by Michael Cropper | Aug 25, 2022 | Developer |
In this blog post we’re going to look at how you can host multiple websites on separate virtual machines that sit behind a pfSense firewall with HA Proxy installed. This is quite an involved topic and one that is going to vary greatly based on your physical hardware and virtualisation environments, so keep this in mind if you’re trying to follow this.
For reference, the underlying physical hardware behind the below setup is nothing more than;
- Physical Modem
- Physical pfSense Firewall
- Physical Managed Switch
- Physical Server running XCP-ng
- Multiple Virtual Servers running inside XCP-ng
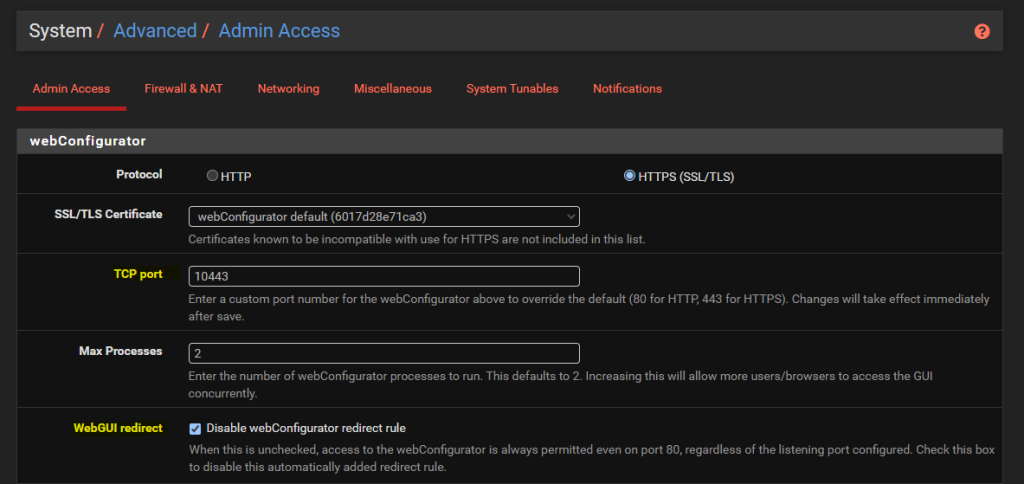
Configure pfSense System > Advanced > Admin Access
By default the pfSense WebGUI runs over port 80 and 443. What this means is that if you want to host a website behind pfSense then you need to re-configure this since your websites are going to be running over either HTTP or HTTPS.
To do this, simply change the TCP Port to an available port and disable the webConfigurator Redirect Rule as can be seen below;
Install HA Proxy via pfSense Package Manager
The first place to get started is to install the latest version of HA Proxy via the pfSense package manager by navigating through to System > Package Manager > Available Packages. Simply install the package and you’ll see this software now available for you to manage and configure.

Whenever you install packages within pfSense you’ll notice different menu items start to appear where you can configure the package and/or view the current use of it. The core menu item for configuring HA Proxy is under Services > HA Proxy;
HA Proxy Terminology and Architecture
Before we jump into the configuration for how to setup HA Proxy to host multiple websites, it’s first important to make sure we understand the overall architecture and how things fit together as the terminology and user interface often isn’t as clear as it could be for someone brand new to this. By understanding this, the configuration we’re going to go through below should hopefully make much more sense why we are configuring the things we are and ultimately will help you work with HA Proxy better in the future.
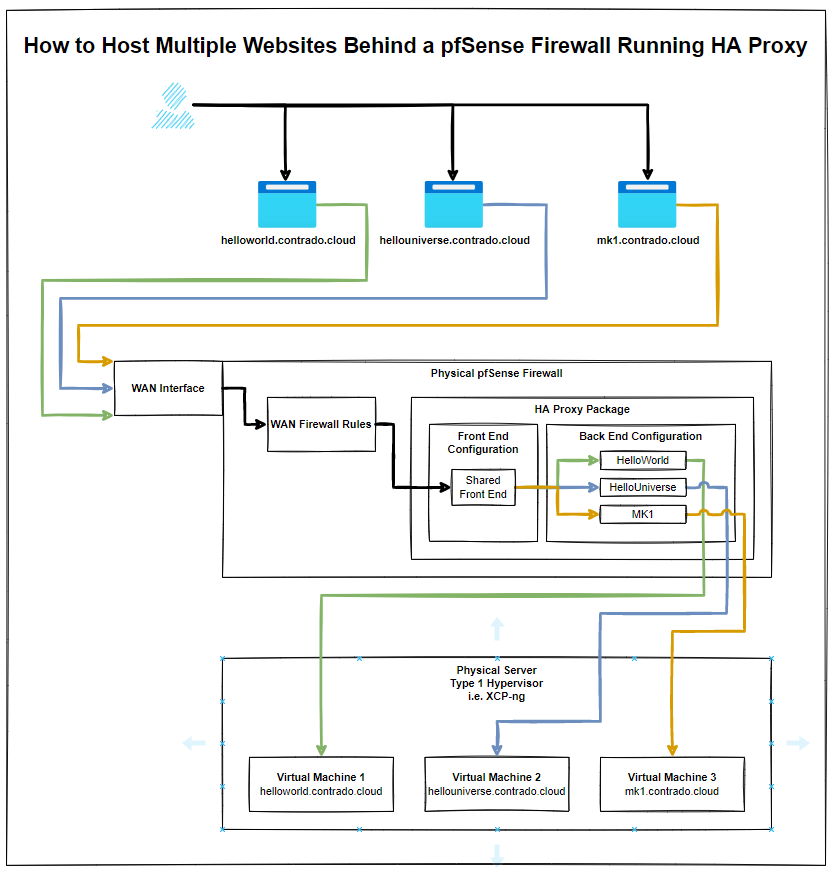
The below architecture is what we’re going to talk through in this guide for how to setup HA proxy on pfSense to allow you to host multiple websites behind a single IP address using a shared front end;
The core bits of terminology in HA Proxy that may not be as familiar to those coming from a web development background are the concepts of Front Ends and Back Ends, since these mean significantly different things in the world of web development. In web development, Front End generally refers to technologies such as HTML, CSS, JavaScript. And Back End tends to refer to server side technologies such as Java and C# to name a few for the purpose of illustration.
Those more familiar with scalable infrastructure in the web development world will be more used to the terms from cloud platforms such as AWS where there is the use of Application Load Balancers and Target Groups.
How this translates into HA Proxy terminology is that an Application Load Balancer in AWS terminology is essentially a HA Proxy Front End, and the AWS Target Group is equivalent to HA Proxy’s Back End. i.e. it is a configuration space that ultimately points to an upstream server somewhere.
And for those of you familiar with Nginx and using this as a reverse proxy, then the Back End in HA Proxy terminology tends to align closely with Upstream Server in Nginx terminology. All fun and games when every piece of technology calls essentially the same thing something completely different.
Anyhow, hopefully that’s helped to clarify a few bits of the terminology related to HA Proxy and how it loosely aligns with terminology that you may be more familiar with if you’re coming from a cloud native or web development background.
Configure HA Proxy Settings
So far all we’ve done is install the basic package with nothing configured and nothing turned on. Now we understand the architecture as explained earlier, it’s time to jump into some of the settings. First we’ll get started with the overall HA Proxy Settings.
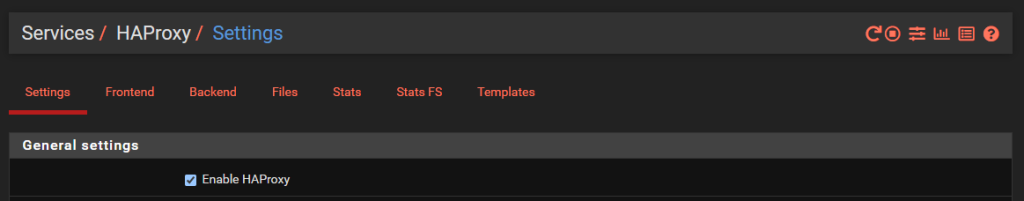
Turn on HA Proxy
Firstly, let’s make sure HA Proxy is turned on;
Turn on HA Proxy Statistics
To do this simply configure a relevant port on the settings page;
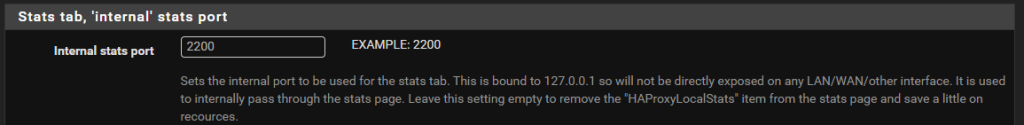
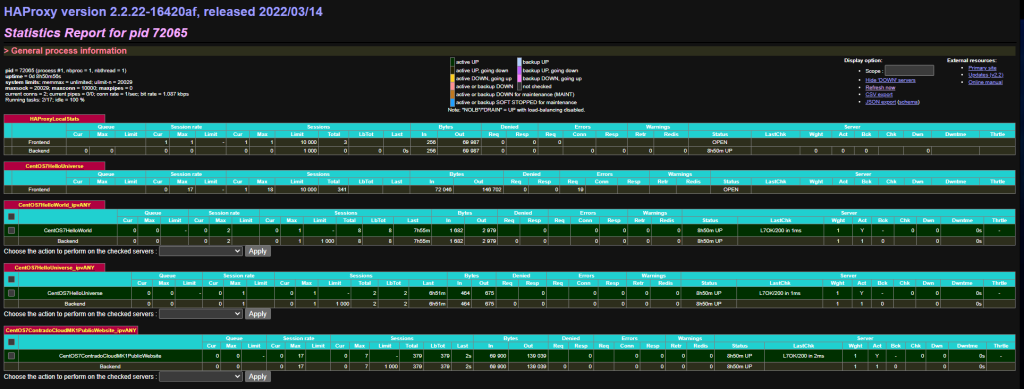
What this gives you is an extremely handy report that you can view from Status > HA Proxy Stats page which allows you to view lots of valuable information so you can understand how many sessions are hitting your Front Ends and Back Ends in HA Proxy once these have been set up a little later. This is significantly valuable when trying to debug things if they aren/aren’t working. Jumping ahead a little, but this is worth turning on while you are in this area of the configuration’
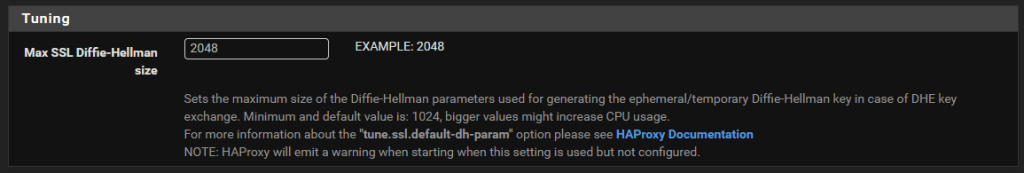
Configure the Max SSL Diffie-Hellman Size
Don’t ask me what this is, I genuinely don’t have a clue at this point in time of writing. An error message showed up in HA Proxy/pfSense when configuring future steps below which needed this setting up. So hey, do what it recommends – Seems odd that it wouldn’t automatically populate with best practice and requires a manual configuration but hey, probably one for a future contribution to the open source project by someone;
Summary of Settings Configuration
You’ll notice that we’ve skipped over a lot of the settings that are available to configure and for genuine reason. And that is that you just don’t need the majority of them to get a basic setup in place to start testing this stuff.
Sure, in a production environment you’re going to need to get finer tuning in place, but while you’re learning this then it’s more important to get a basic setup in place that you can play with and improve from there.
Setup Your Virtual Machines
Ok, so for the purpose of this blog post I’m going to assume you already have got some virtual machines set up and working in the way you want with the appropriate security in place to ensure that they are securely segmented for public access.
In our example, we’ve got the three virtual machines that are powering;
- contrado.cloud
- contrado.cloud
- contrado.cloud
In this example they have simply been configured to run Apache / httpd, configured to ensure httpd runs on startup, configured to allow inbound http traffic and added a basic index.html page in /var/www/html/index.html so that we can easily see which server we are on. Beyond that, everything else is out of the box on these virtual machines.
Configure HA Proxy Back Ends
This seems really counter intuitive to do this first, but it’s essential to do this first. This is what we’re going to achieve with this example;
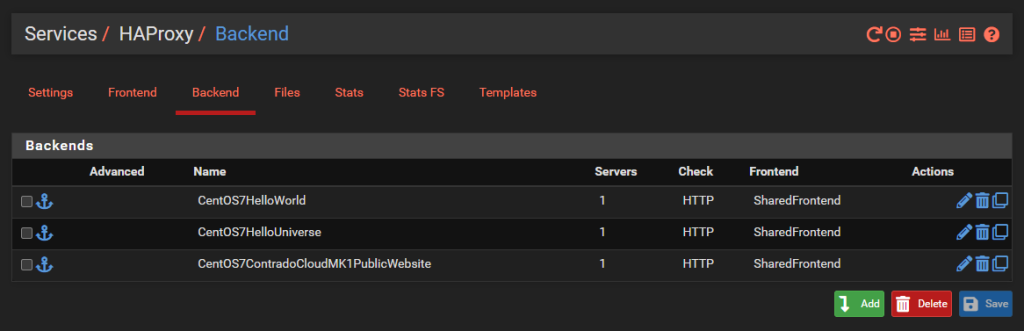
And we’ll dig into a single one as an example, the others are the same though with no differences beyond IP addresses. So configure your first Back End in HA Proxy;
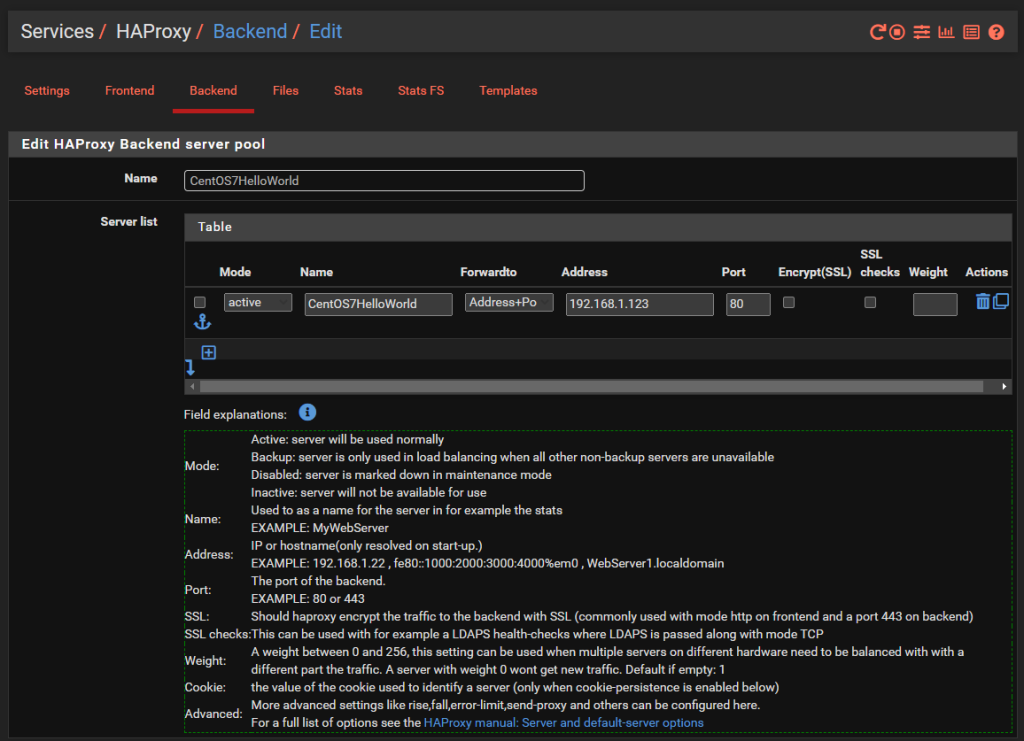
You’ll notice that the IP address is on the 192.168.1.0/24 LAN network which is clearly insecure, as is the Port 80 for insecure HTTP traffic for any real world production environment. But at least this gives an example for how to get this set up as a starting point.
There is nothing really to configure as a basic setup beyond the above. You can go configuring the Health Checking if you like, which is essential in production environments with High Availability Front Ends and disposable back end servers and infrastructure as code, but that’s well beyond the scope of this blog post. So either disable this by setting the option to None or configure as per your needs.
Rinse and repeat for your other virtual machines that you want to expose to the internet.
Configure HA Proxy Shared Front End
Note, if you are only hosting a single website then you can use a basic Front End rather than a shared front end, the configuration steps are very similar. You actually don’t even need to use HA Proxy if you are only hosting a single website as you can use basic Port Forwarding in pfSense as we’ve previously written a basic guide for on how to host a single website behind a pfSense firewall which you should check out if this situation applies to you.
Now that you have all of your Back End HA Proxy configured, it’s time to apply a Front End to handle traffic from the internet in a way that suits your needs. As this blog post is about hosting multiple websites behind pfSense using HA Proxy, the reality is that this is going to be primarily determined by the hostname of the incoming request, i.e. http://helloworld.contrado.cloud or http://hellouniverse.contrado.cloud or http://mk1.contrado.cloud etc.
For context, HA Proxy is really designed for traditional network infrastructure where you essentially don’t expose anything to the internet and anything you do you do minimally and with great caution. In the world of cloud and web development, well, this doesn’t quite meet expectations. There will be future blog posts about other supporting technologies in due course which significantly expand the capabilities and functionality that is explained in this blog post. This is just the basics for now.
What we’re aiming to achieve with a shared Front End in HA Proxy is the following;
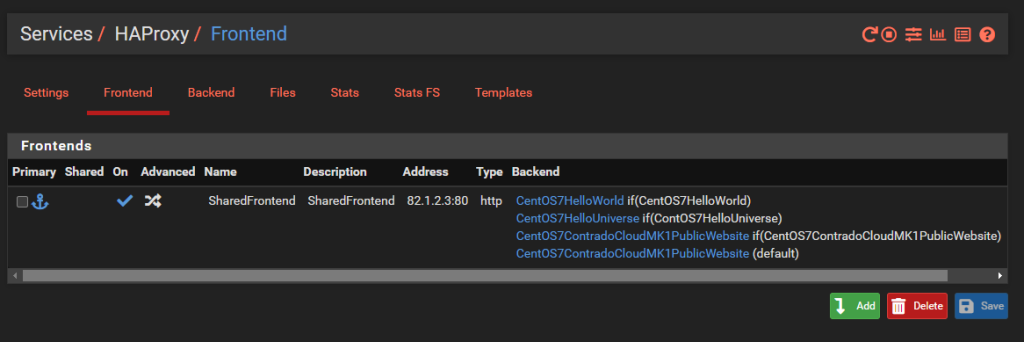
What you’ll notice is that this is purely for Port 80. This comes back to the point raised earlier that the default behaviour for pfSense and HA Proxy in general is to disable all and specifically permit inbound rules. In reality, any website that is being hosted is highly likely to require multiple ports to be opened to be managed remotely with ease such as HTTP, HTTPS, SSH, SFTP and many more. That all comes down to your specific use case though, so this blog post is simply designed to get you going in the right direction, not give you all the answers to your specific use case.
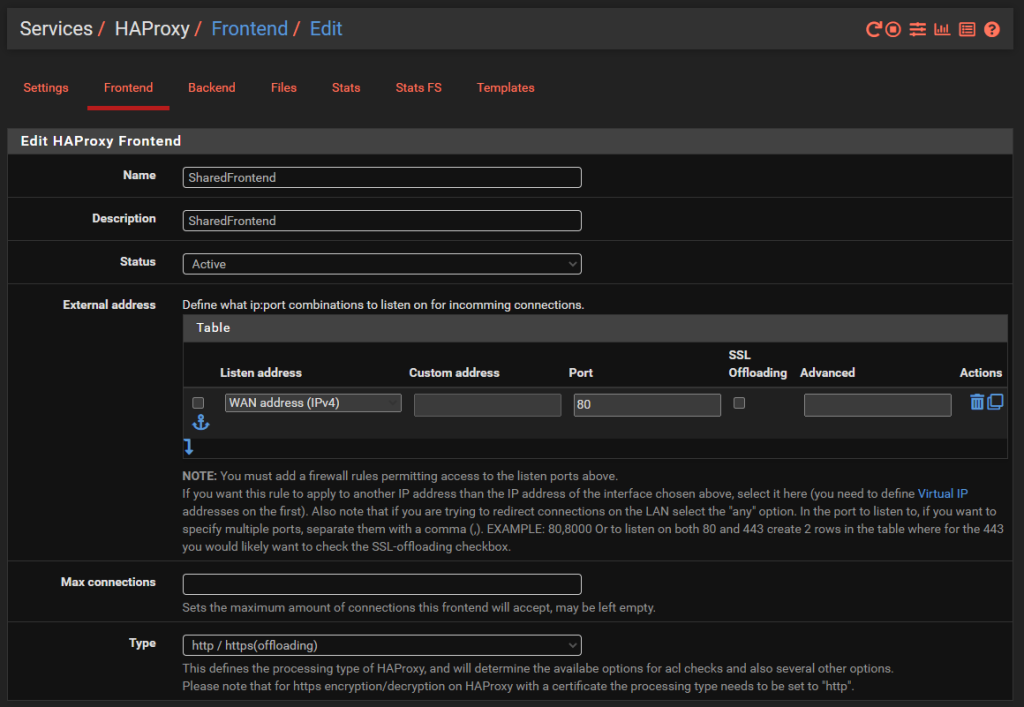
Jumping into the specific details of the above to get clarity on how this is configured. Simply give the Front End a Name, Description, make sure it’s Active and listening on the WAN on port 80 then set the Type to ‘http / https (offloading)’ as can be seen in the image below;
The next bit of configuration on your Front End is to configure what rules you need in place to allow your front end to talk to multiple back ends depending on your setup. For this blog post we’ve simply got the 3x virtual machines powering the HelloWorld, HelloUniverse and MK1 sub-domains to see how this works.
Firstly, configure your Access Control Lists which in this example simply gives you a way to map a hostname to a friendly name.
Next, configure the Actions by mapping how each of the Access Control List friendly names maps to a Back End in HA Proxy. The user interface in here isn’t the best if I’m honest. These things should be selectable dropdowns rather than free text field as it causes confusion, but hey.
Finally, select which is the default Back End so that HA Proxy knows where to send traffic when it doesn’t know what to do with it.
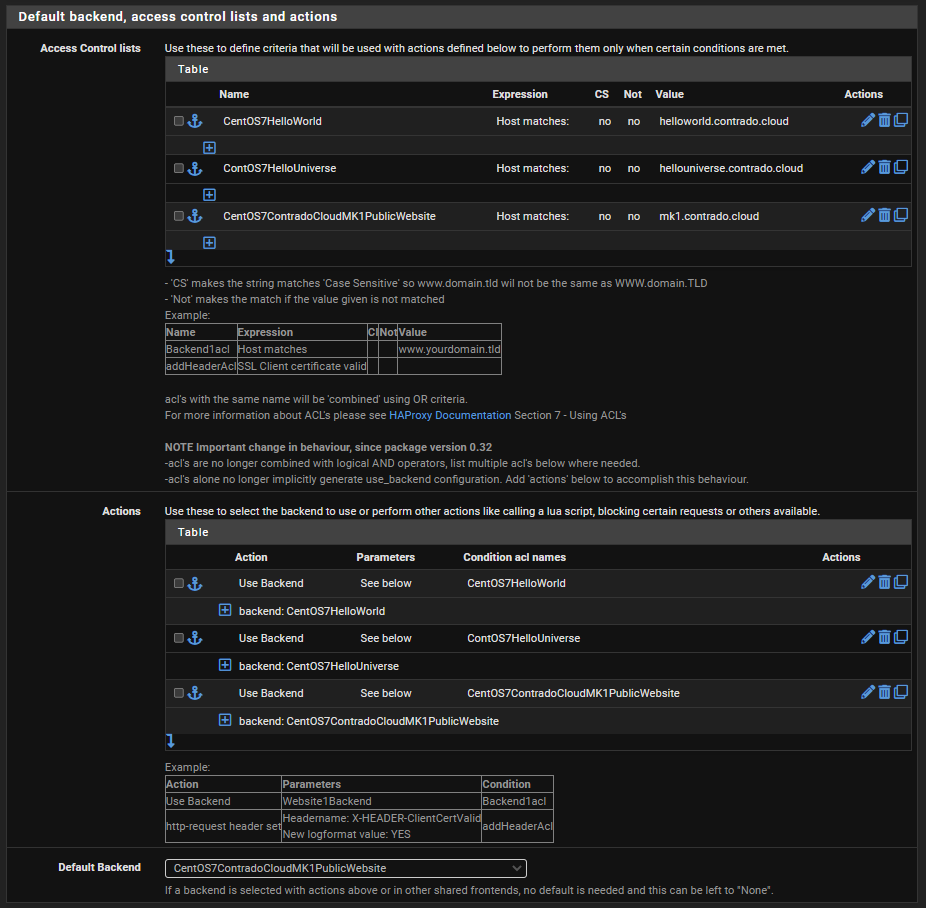
And that’s it for configuring HA Proxy. There are so many different settings throughout all those different screens we’ve looked at, but ultimately to get a very basic implementation set up so you can have a baseline to play with and improve up, this is all there is to it.
Configure pfSense Firewall Rules
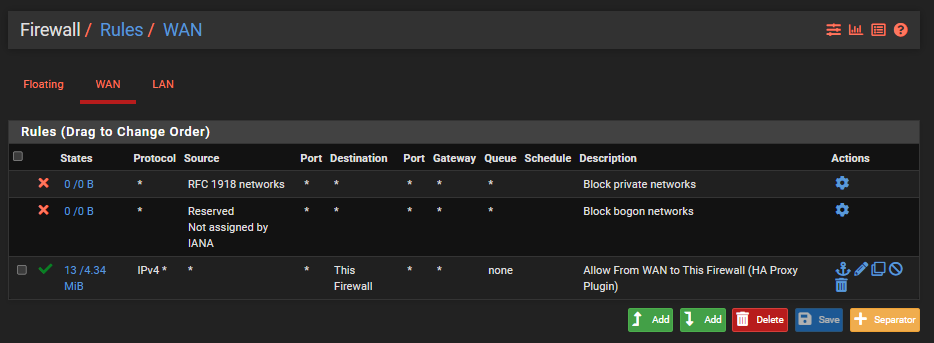
Last step is to ensure you have a firewall rule on your WAN interface so that inbound traffic to the WAN from the internet can talk to the firewall and hence HA Proxy so that HA Proxy can then direct the inbound traffic to the correct destination based on what you have configured. Note that the top two rules in the screenshot below are out of the box pfSense rules to protect your network.
Check Everything is Working
Now simply navigate to your Sub-Domains and check everything is loading correctly as you expect.

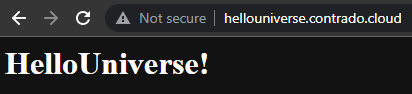
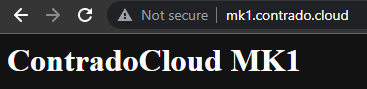
Awesome!
Final Considerations
This blog post is an extremely basic setup looking at only a single port. In reality, websites are complex, particularly when hosting a wide variety of services and even more complicated when you start to look at how SSL certificates are managed and where etc. Things start to get significantly more complex from this point.
Also, don’t forget to configure things such as static IP addresses for your virtual machines, ensure Apache or Nginx is starting on boot and your firewalls on your virtual machines are allowing inbound traffic on the ports you require open as most operating systems these days default to only allowing SSH traffic in by default.
There are a lot of jumps that your connection is going through as you work through the steps, so if something isn’t working for you, be extremely methodical to trace this through step by step and confirm if the traffic is hitting the next hop or not. This is often half the battle getting these things set up properly.
Summary
Hopefully by now, the pfSense and HA Proxy architecture diagram from earlier in this blog post is making sense what we’ve configured and how we’ve configured it. All of this should help get you going in the right direction to then further customise this to your specific use case.
As always, keep security in mind at all times. What has been outlined above is an extremely insecure setup on a flat network and running over HTTP. All of the IPs and custom configurations have naturally been changed for the purpose of this example tutorial as it is designed to get you understanding the basics. We’ve other blog posts on the site for how to configure things such as managed switches and pfSense so take a look around for other helpful content.
Hey, if you’re lucky and you test one of the hostnames that have been mentioned on this site, you may even see the websites up and running. The underlying infrastructure behind this is very much a part timer at the moment, only turned on when I’m having a play around.
by Michael Cropper | Aug 20, 2022 | Developer |
Ok, before start let’s acknowledge that this blog post is an extremely complex topic. That being said, let’s get the foundational understanding in place for the readers before we jump into the complexities.
What is Xen
Xen is simply the type 1 Hypervisor that runs on the bare metal, aka. Xen Project. This is an open source project that has had an enormous amount of contributions from the big players including Citrix, Arm, SuSE, AWS, Alibaba, CentOS, Debian, Oracle, RedHat, Ubuntu, XCP-ng and many more.
What is Citrix Xen Centre
Citrix Xen Centre is the software that is installed on a separate physical machine that is used to control Xen. Such as spinning up new virtual machines, configuring networks and managing storage.
What is XCP-ng Centre
XCP-ng Centre is the software that is installed on a separate physical machine that is used to control Xen. Such as spinning up new virtual machines, configuring networks and managing storage. This software is a fork of Citrix Xen Centre which was created during the transition to fully open source where Citrix released the reigns and control on the project.
What is Xen Orchestra (XO)
Xen Orchestra (XO) is the open source technology for managing Xen infrastructure via a user friendly web based user interface to allow the general user to control everything than Xen can do under the hood. Whereas Citrix Xen Centre and XCP-ng Centre are installed applications on a separate physical device, Xen Orchestra can be run within a host itself.
What is really interesting about Xen Orchestra is that you can actually install it within a virtual machine on a physical server where XCP-ng Server installed on. You may think this is counter intuitive and, well, it kind of is because from a hierarchical perspective, the virtual machine is effectively controlling the parent server for spinning up new virtual machines and more. This is pretty cool, but as always, keep security in mind and plan these things well if you are doing this.
If you’re looking for a guide on how to install Xen Orchestra (XO) from Sources then checkout the link. This guide will talk you through the finer details of how to get Xen Orchestra setup with ease to help you manage your virtual machines with ease and without limitations.
What is Xen Orchestra Appliance (XOA)
Xen Orchestra Appliance (XOA) is the commercial implementation of the open source Xen Orchestra (XO). This is managed by Vates, a French company who is leading the development of the open source project to maturity. Hat’s off to them and Olivier Lambert as the lead.
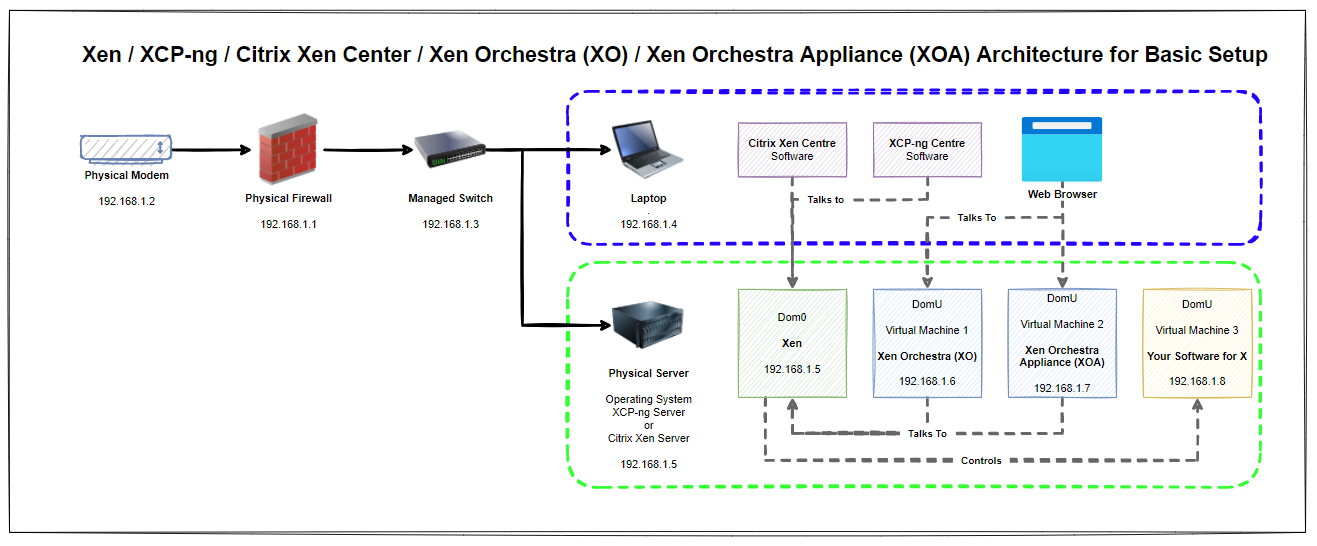
Architecture
So what does all this mean? Well, essentially that Xen / Xen Server / XCP-ng Server is installed on the physical machine and that this can be controlled / manged using either Citrix Xen Centre, XCP-ng Centre, Xen Orchestra (XO) or Xen Orchestra Appliance (XOA). Simple right?
Think of the control systems (Citrix Xen Centre, XCP-ng Centre, Xen Orchestra and Xen Orchestra Appliance) as input/control devices. In much the same way that a keyboard and mouse act, they are both input devices into a computer where you can achieve the same goals in one way or another.

Naturally for this basic setup you’ll notice that everything is on a flat network, aka. no securely segmented networks. This is rarely a good idea in a production environment, but at least this basic setup helps you to get the base level understanding for how things plug together under the hood and helps to align terminology and understanding.
What is not always commonly understood is that Citrix Xen Centre can control both Citrix Xen Server and XCP-ng Server. Likewise, XCP-ng Centre can control both Citrix Xen Server and XCP-ng Server as XCP-ng was forked from the Citrix setup when it was open sourced. Quite handy to know.
Synchronisation
What is important to understand with all the above in mind is that it is not the tool that is mastering the configuration data, but the tools are there to control the mastering of the configuration data. What this means is that if you have multiple of the control devices installed on your machine then you’ll notice that they all update whenever one of them updates the configuration, as they are all reading/controlling the same physical device.
Summary
Given the above descriptions and architectural diagrams, hopefully it is now clear how you can manage Xen using a multitude of tools based on your individual user preference. What is hopefully clear is that this is a complex topic and one that often ends in a question being answered as “it depends”.
Hopefully this blog post has helped to align understanding of how the different dots connect together to help you in your understanding of what you need to achieve for your specific use case.
by Michael Cropper | Aug 15, 2022 | Developer |
To ensure terminology is fully understood, XOA stands for Xen-Orchestra Appliance. It is the commercial side of Xen-Orchestra, which to add to confusion, also offers a free version of XOA with a slightly limited feature set.
So when we say “Install XO from Sources” what this actually means is that we’re installing the open source Xen-Orchestra, not the commercial XOA aka. Xen-Orchestra Appliance.
One important point that many people don’t realise is that Xen-Orchestra can actually manage the physical host server where it is installed within a virtual machine on that server. Pretty cool, right.
Step 1 – Create a Virtual Machine Running Debian 11 Bullseye
Firstly, give this virtual machine as much vCPUs and RAM that you can spare on the initial setup as this is a fairly resource intensive task getting this setup. Thankfully there is a handy XenOrchestraInstallerUpdater piece of software on GitHub from Roni Väyrynen and other contributors.
I’ve chosen the above as at the time of writing Debian 11 Bullseye is the latest supported Debian version that the above script supports.
Step 2 – Understand Sudo Permissions Have Changed in Debian 10 + 11
Yup. Your usual ‘sudo –s’ command and SSH’ing in as a root user simply no longer work on Debian 10 + 11. A rather annoying undocumented piece of information given the significance of this change. But hey, that’s why I’m writing about it here.
By default on Debian 10 and Debian 11, the root user is not included in the sudoers list, so you can’t SSH in using the user ‘root’. And on top of that, if you try to SSH into your Debian 10 or 11 virtual machine as ‘{YourUsername}’ that you configured on setup, you’ll notice that if you run the common command ‘sudo –s’ to switch to the root user, you get an error saying that your username isn’t in the sudoers list.
Say what?
Anyhow, the new command seems to be “su –“ which behaves in the same way and gets you to where you need to be.
Step 3 – Install Git
We’re going to be pulling in and running the code from the GitHub repository mentioned earlier, so to do this we need to ensure Git is install on the virtual machine so that it’s possible to download the code we need for XenOrchestraInstallerUpdater.
Simply run the command;
apt-get install git
Step 4 – Clone XenOrchestraInstallerUpdater Git Repository
Next step is to get the code from GitHub down onto your virtual machine. So simply run the command;
git clone https://github.com/ronivay/XenOrchestraInstallerUpdater.git
This will download the code to the directory you are currently in. Make a note of this and make sure you’ve put this in a sensible place that you’re going to be able to find later on.
(Optional) Create a Self-Signed SSL Certificate
The reason why this step is optional is that for playing around you don’t really need to bother with this. But obviously for production environments you want to keep security at the forefront of your mind. To be clear, this isn’t a recommendation for how to use HTTPS in a production environment, this is simply a quick way of getting SSL up and running should you choose to experiment with this;
cd /etc/ssl
mkdir xo
cd xo
openssl req –newkey rsa:4096 –x509 –sha256 –days 3650 –nodes –out xo.crt –keyout xo.key
Step 5 – Create a Copy of Configuration Files
Thankfully Xen-Orchestra comes with some handy configuration files so you don’t need to start from scratch. To copy these and make them your own simply run the following command;
cp sample.xo-install.cfg xo-install.cfg
This is the copy command, aka ‘cp’. This is saying copy the file ‘sample.xo-install.cfg’ and then paste the file with a new filename to ‘xo-install.cfg’. The joys of Linux commands.
(Optional) Configure your Xen-Orchestra Configuration File
To do this, simply run the command;
nano xo-install.cfg
Now, you only need to do this if you’ve implemented the optional step above to create an SSL certificate. If you have done this, you need to specify the location of those certificate files within your Xen-Orchestra configuration file. As an example following on from the above, this is how your configuration file would look;
# Location of pem certificate/key files. Installation will automatically configure HTTPS if these are defined. Remember to change PORT variable as well.
PATH_TO_HTTPS_CERT=/etc/ssl/xo/xo.crt
PATH_TO_HTTPS_KEY=/etc/ssl/xo/xo.key
Save the file and exit.
Step 6 – Install Xen-Orchestra (XO) from Sources
Simply run the following command and watch as things progress;
./xo-install.sh
Wait a while, watch things progress and then you’re good to go.
Step 7 – Confirm Setup Works
You’ll know that the setup works for two reasons. Firstly, the console will have lots of success messages and will tell you that everything has completed successfully. Secondly, you’ll now be able to access the IP address of the virtual machine in your web browser to login to Xen-Orchestra, the completely free and unlimited feature access to the platform so you can play around to your hearts content. Job done.
The default username and password for XO Xen-Orchestra is;
Username: admin@admin.net
Password: password
Naturally I don’t need to remind you that this is extremely insecure, so make sure to change this once you’ve got this setup.
Summary
So that’s how to get XO aka. Xen-Orchestra set up on a virtual machine inside a physical XCP-ng Server so that you can have a play around. You’ll notice that this is slightly different than how to get XOA setup via the Quick Deploy feature once you’ve got XCP-ng Server setup, but that’s a fairly straight forward click and configuration setup, but with limited features at the end of it.
The above shows you how to get the basics set up in no time with relative ease and one core dependency on the script from GitHub. The contents of this blog post have been pulled together from various snippets of insight around the internet to provide a clear guide for how to do this, with a couple of key mentions being LTS and Vates and Roni Väyrynen for both help with online video content and conversations to help identify the nuggets of information joining the dots together with the information for how to get the above setup with ease, at least the missing nuggets of information in my brain – it may be straight forward to others!
by Michael Cropper | Aug 9, 2022 | Developer |
This is quite a complex topic, and one that all depends on your specific setup. So we’re going to take a look at some of the options for how to get this set up with ease. Is what we’re going to talk through the best practice? Not sure. But I’ve not found any useful information online for a better approach, so to quote Admiral Adama from Battlestar Galactica when asked the question “So what’s your plan here?” he answers “Personally, I tend to go with what you know. ‘Til something better turns up”. So if the readers of this blog post have any better ways of doing this, please do share in the comments.
Physical Network Hardware
So let’s get some basics documented. The reality is that every single physical network hardware is going to be different for every organisation. But fundamentally and at the most basic level everyone has at a minimum: Modem –> Firewall –> Managed Switch –> XCP-NG Server –> Virtual Machine(s)
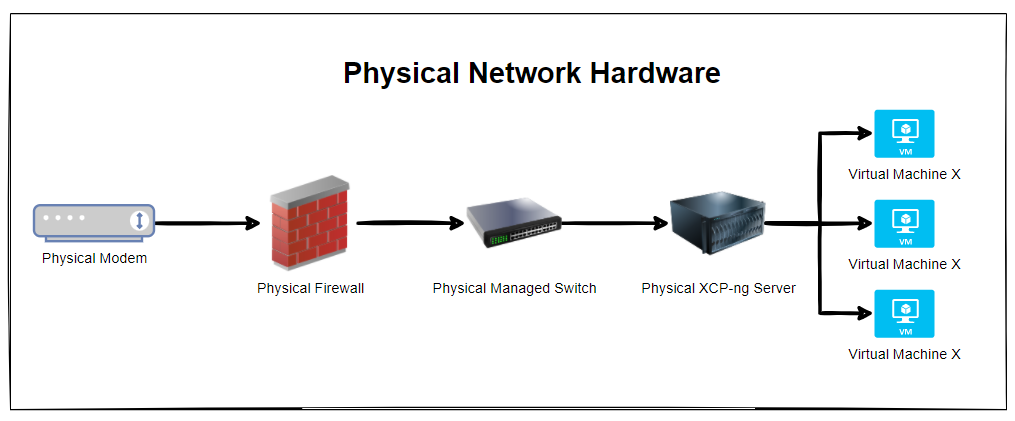
The reality is that in most home setups when people are getting started, most people start off with a single device supplied by the ISP (Internet Service Provider). Often these devices act as everything and nothing, so they perform the absolute basic requirements of a modem, a firewall and a switch, but fail on most things as they can’t handle VLANS, they can’t handle complex firewall rules and they can’t effectively manage complex networks. Typical jack of all trades, master of none.
Ultimately if you are in this home lab setup and wondering why things don’t work. It’s highly likely because you simply don’t have the physical hardware that you need to achieve what you want. Consumer grade hardware simply doesn’t cut it, even the high end consumer grade hardware as this is often designed to visually look powerful through curves/edges and more antennas in design rather than actually being powerful under the hood. Unfortunately in the UK we don’t particularly have the equivalent of an ecommerce store for this kind of stuff to make life easy, the way things work is often behind complex business to business commercial relationships and ‘special’ pricing etc. It’s an absolute nightmare. Perhaps I need to get around to building a business model to help to simplify the supply chain for these things, when I get the time. But hey, I digress. Back to the topic at hand.
Now things get a little more complex than the above as there are physical cables that are connecting the different physical devices, so let’s expand the above architectural diagram to understand the next level of detail. Here we have the setup whereby the firewall has 3x physical ports on the device and we have configured the firewall to have a simple setup of one port = one VLAN.
In reality, many VLANs often share a single physical port on the physical device, but let’s leave that for another blog post to cover off. So then we have the managed switch with the basic setup of 3x inbound connections and 3x outbound connections, each matching a one to one relationship to keep things simple. Again, the reality of any real world implementation is that we use things called Trunk Ports which is just a term that means a physical port that allows traffic to flow to the next physical device for every VLAN and untagged (aka. non-VLAN traffic).
What this ultimately leaves us with is the setup as follows;
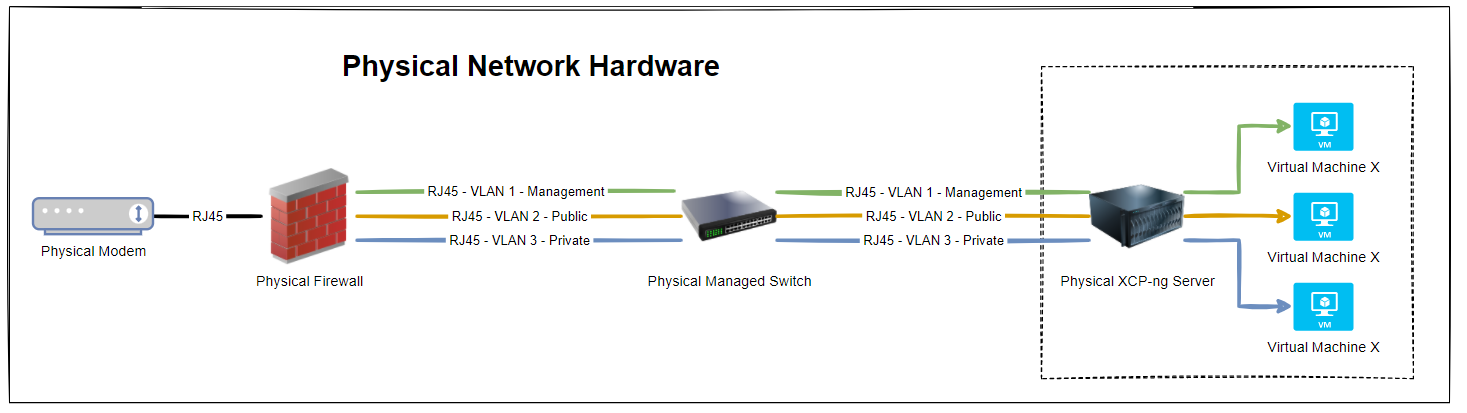
So we have 3x physical RJ45 cables connected between the physical firewall and the physical managed switch, and then another 3x physical RJ45 cables connected between the physical managed switch and the physical type-1 bare metal hypervisor XCP-ng Server. Everyone’s setup is going to be different, but if you’re working with Ubiquiti/UniFi then this guide on how to setup a UniFi managed switch is going to be handy.
But, we’ve jumped ahead a little. You’ll notice in the above diagram that the virtual machines are magically attached to the correct VLANS. But how? You may ask.
How to Configure XCP-ng Centre Networks on First Setup
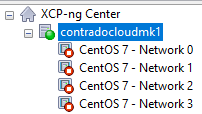
When you first get XCP-ng Server setup and XCP-ng Centre setup, you’ll notice that when you plug in all the Ethernet cables that you are simply presented with a bunch of un-identified networks that you need to figure out what to do with;
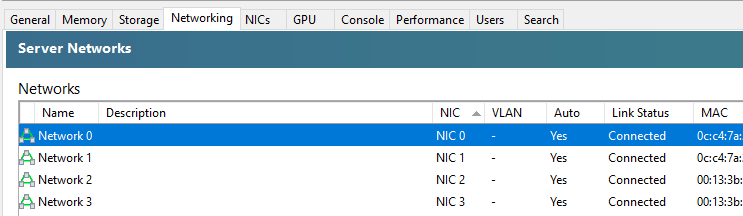
The networks that are listed here within XCP-ng Centre are directly related to the physical ports that you have available on your XCP-ng Server. So you’re probably thinking, awesome, let’s get started and get a virtual machine spun up and get cracking. But it’s not so straight forward. How do you know which network to attach the virtual machine to? After all, your choice here can have security implications depending on your use case. You don’t want a publicly accessible virtual machine to have access to your management network.
So we need to get into the topic of how to identify what networks in XCP-ng Centre map to what VLANs so that you can label them correctly and ultimately use them properly within your configuration. As with everything important, naming conventions and terminology is extremely important so make sure you agree this within your own organisations as appropriately.
The best way I’ve found to easily get this mapped in the first instance is actually quite simple, while not obvious, and it also feels quite rudimentary, it does work. Simply create multiple virtual machines, each one dedicated to a single network, then see what IP address it gets assigned from your DHCP server (likely managed on your firewall and enforced through VLAN configuration in the firewall and managed switch).
This is assuming you’ve already got your XCP-ng Centre configured to connect to your ISO Storage Repository for loading operating systems.
This step certainly feels a bit like using a sledgehammer to crack a nut, but it works. But I’ve yet to find a simpler way to achieve this. Once you’ve gone through this process and run the equivalent of “what’s my IP” (aka. ipconfig or ifconfig etc.) on the virtual machines once you’ve set them up and SSH’d into them, you’ll know definitively which network they are configured against.
So now you need to rename your networks within XCP-ng Centre.
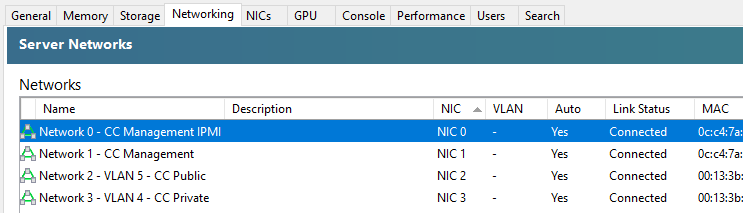
You’ll notice in the above screenshot that we don’t have the VLAN column populated, and that is purely because there are pending internal decisions to be made around the above setup on this specific use case, but you get the idea of how you can make sure the Network Interface Cards (NICs) map through to the XCP-ng Centre networks.
As with everything in IT “It depends” 😀
Summary
The reality is that what we have gone through in this blog post is an extremely basic setup in the real world. What I hope has been conveyed throughout this blog post is one practical way of mapping when things are physically plugged-in to different network ports and how we can determine which actual networks they belong to before we start deploying different virtual machines for different use cases.
by Michael Cropper | Aug 7, 2022 | Developer |
Ok, so we’ve done a recent blog post on how to setup XCP-NG Tools on CentOS 7. So this blog post is going to be a rather similar blog post which a few nuances.
Pre-Check
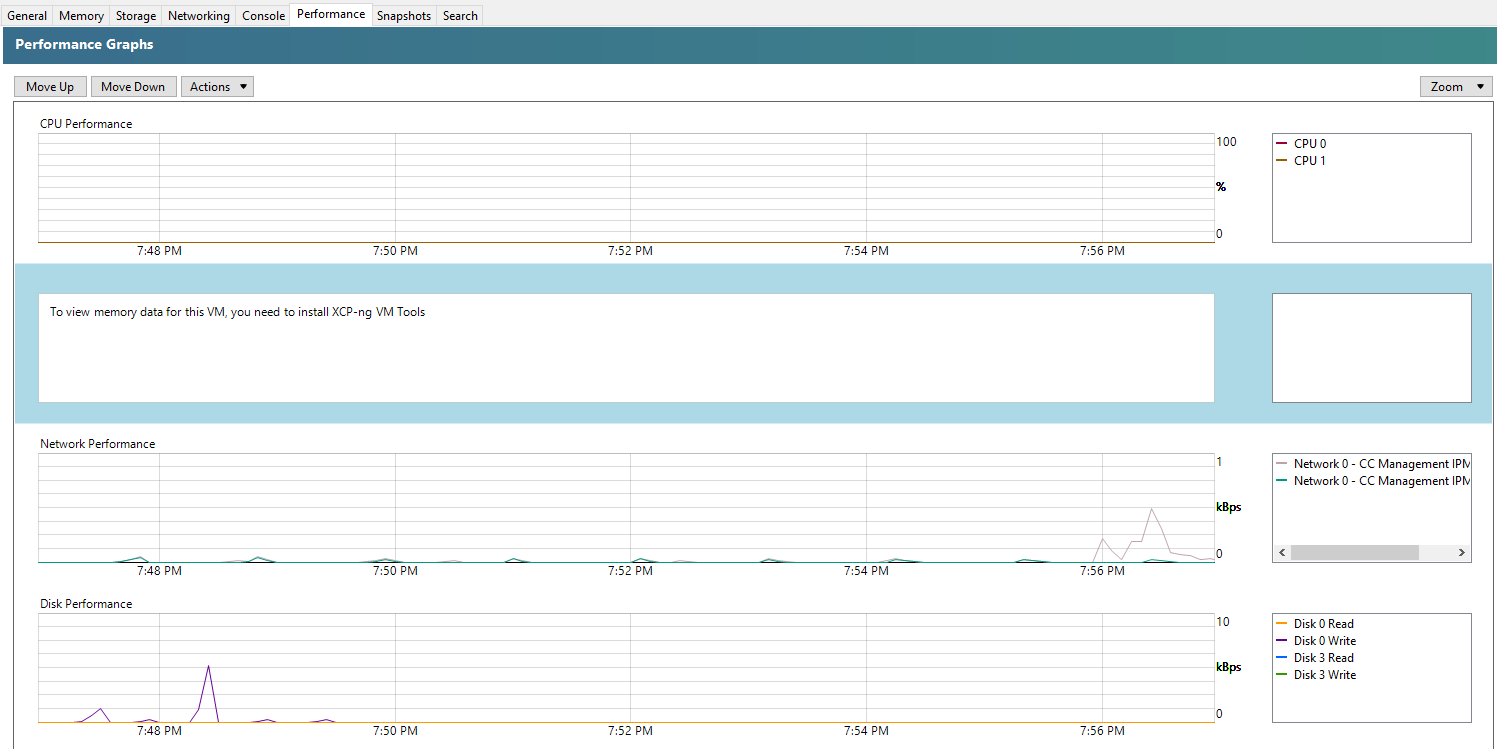
You’ll notice that XCP-NG Tools is not installed when you check the Performance tab against your Debian 11 Bullseye virtual machine as you’ll see the message “To view memory data for this VM, you need to install XCP-ng VM Tools”;
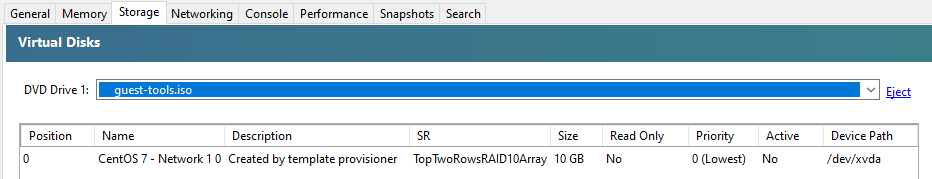
Step 1 – Insert the guest-tools.iso in the Virtual Disk
To do this, go into your virtual machine within XCP-NG Centre, then into the Storage tab, then make sure that within your DVD Drive you have the XCP-NG VM Tools is selected;
Step 2 – SSH Into the Virtual Machine
Next step is pretty straight forward, SSH into your virtual machine so you can run the commands to install XCP-NG Tools on Debian 11 Bullseye.
Step 3 – Switch to Sudo
This step is one that isn’t particularly well documented online. As of Debian 10 Buster release and also continued within Debian 11 Bullseye release, to switch to the sudo user you need to run the command;
sudo –

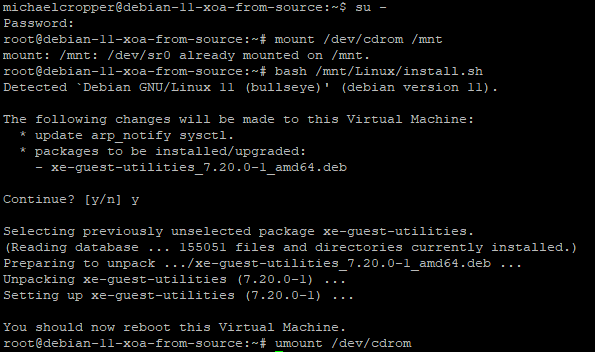
Step 4 – Mount the CD-ROM/DVD Drive
This step is to ensure that your Debian 11 Bullseye can access the contents of the virtual CD-ROM/DVD Drive that we configured within step 1. To do this, simply run the command;
mount /dev/cdrom /mnt/
What the above command is saying is…..Mount the folder path at /dev/cdrom to the folder location /mnt/ – There is nothing more to it than that.
Step 5 – Run the install script for XCP-NG Tools
Now that your Debian 11 Bullseye virtual machine has access to the contents in your virtual CD-ROM/DVD Drive which contains the guest-tools.iso contents, it’s time to run the installation script.
bash /mnt/Linux/install.sh
Follow the steps and you’re on your way. You’ll know that XCP-NG Tools has been successfully installed because you’ll get a confirmation message;
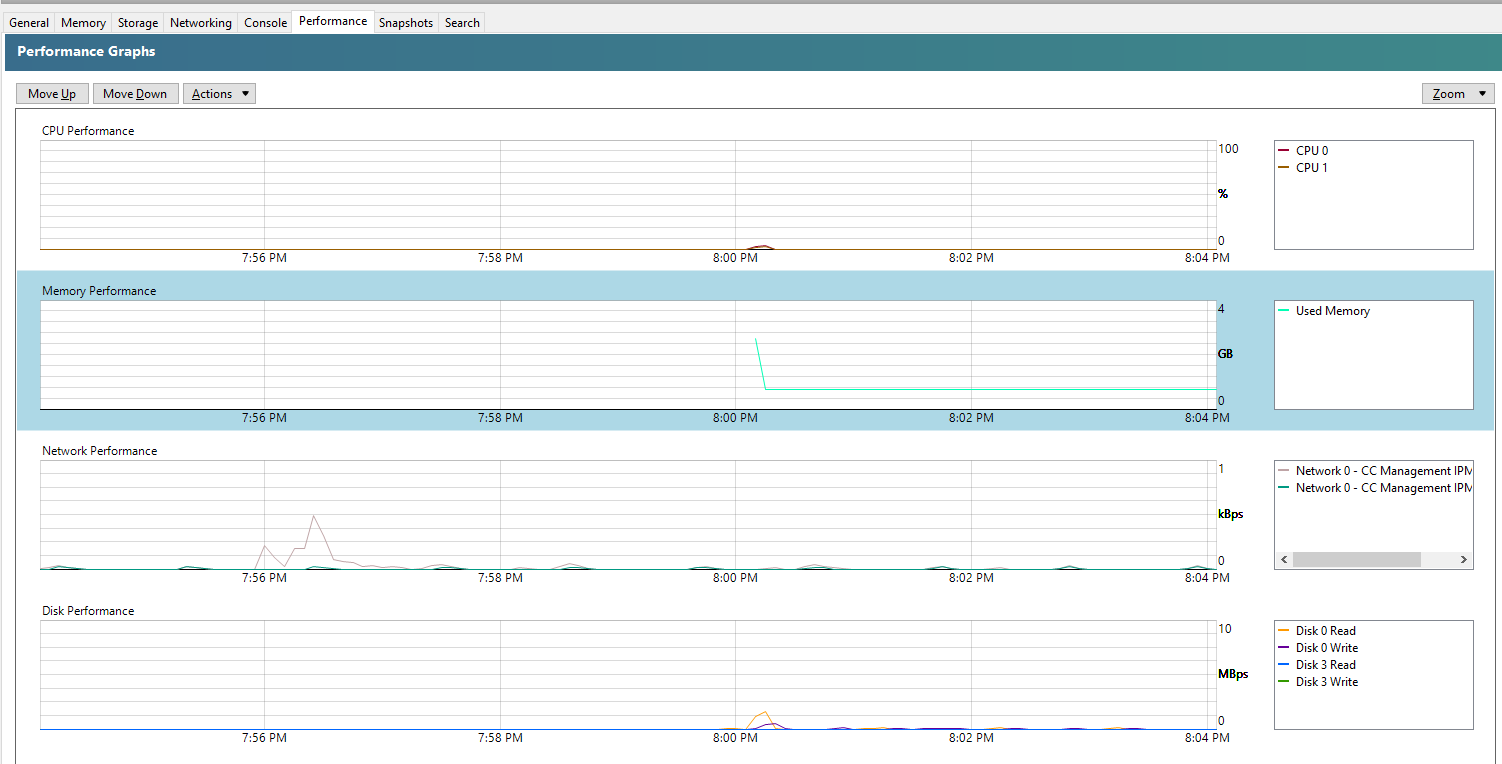
And you’ll also note that within the Performance tab against your Debian 11 Bullseye virtual machine that the memory data starts to come through in a matter of minutes at the absolute most, in most cases in about 30 seconds, even without rebooting;
Summary
When you follow these simple steps, it’s a few clicks and commands to get XCP-NG Tools up and running on Debian 11 Bullseye via XCP-NG Centre. For every virtual machine that you setup, make sure you install XCP-NG Tools to make your life as easy as possible.
by Michael Cropper | Aug 7, 2022 | Developer |
Short blog post with a simple few commands to get you up and running quickly. XCP-NG Tools is also commonly referred to as Xen Tools, even though the two are technically different, XCP-NG Tools is based on Xen Tools, but that’s a topic for another day.
Pre-Check
You’ll notice that XCP-NG Tools is not installed when you check the Performance tab against your CentOS 7 virtual machine as you’ll see the message “To view memory data for this VM, you need to install XCP-ng VM Tools”;
Step 1 – Insert the guest-tools.iso in the Virtual Disk
To do this, go into your virtual machine within XCP-NG Centre, then into the Storage tab, then make sure that within your DVD Drive you have the XCP-NG VM Tools is selected;
Step 2 – SSH Into the Virtual Machine
Next step is pretty straight forward, SSH into your virtual machine so you can run the commands to install XCP-NG Tools on CentOS 7.
Step 3 – Mount the CD-ROM/DVD Drive
This step is to ensure that your Linux CentOS 7 can access the contents of the virtual CD-ROM/DVD Drive that we configured within step 1. To do this, simply run the command;
mount /dev/cdrom /mnt/
What the above command is saying is…..Mount the folder path at /dev/cdrom to the folder location /mnt/ – There is nothing more to it than that.
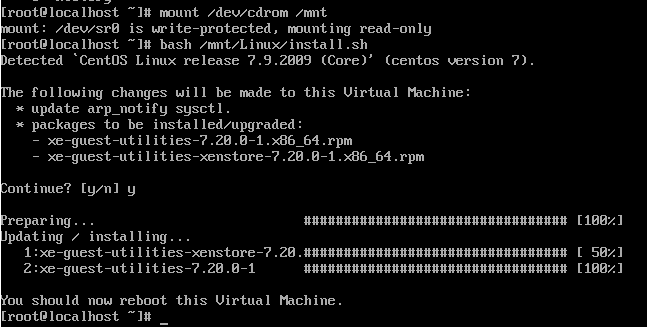
Step 4 – Run the install script for XCP-NG Tools
Now that your CentOS 7 virtual machine has access to the contents in your virtual CD-ROM/DVD Drive which contains the guest-tools.iso contents, it’s time to run the installation script.
bash /mnt/Linux/install.sh
Follow the steps and you’re on your way. You’ll know that XCP-NG Tools has been successfully installed because you’ll get a confirmation message;
And you’ll also note that within the Performance tab against your CentOS 7 virtual machine that the memory data starts to come through in a matter of minutes at the absolute most, in most cases in about 30 seconds, even without rebooting;
Summary
When you follow these simple steps, it’s a few clicks and commands to get XCP-NG Tools up and running on CentOS 7 via XCP-NG Centre. For every virtual machine that you setup, make sure you install XCP-NG Tools to make your life as easy as possible.
by Michael Cropper | Aug 1, 2022 | Developer |
This is one that comes up fairly infrequently and one that always seems to take way more Googling than it should to get a straight answer on this. When in fact, the answer to this question is an extremely simple one, well, usually.
If you are getting regular or intermittent errors with your scripts timing out, count the seconds. Most people are used to having a default timeout with something like Apache Httpd to be 30 seconds. Well, Apache Tomcat likes to play by it’s own rules here and doesn’t quite follow that standard which may leave you scratching your head for a while until you get to the bottom of it.
Here’s what the official Tomcat 8.5 documentation says on the topic;
“The number of milliseconds this Connector will wait, after accepting a connection, for the request URI line to be presented. Use a value of -1 to indicate no (i.e. infinite) timeout. The default value is 60000 (i.e. 60 seconds) but note that the standard server.xml that ships with Tomcat sets this to 20000 (i.e. 20 seconds). Unless disableUploadTimeout is set to false, this timeout will also be used when reading the request body (if any).”
Simple, right?
Basically, just check what you’ve got in your server.xml file and adjust accordingly as it’s not as straight forward as it should be.
But where is that file you may be wondering. Well, by default you’ll find the file at /{TOMCAT_HOME}/conf/server.xml so check there first.
This home directory is going to be different depending on operating system and how Tomcat was installed, so you may have to hunt around for this if you’ve not edited these settings before. Make a note of this file location as it will come in handy over time.
The line you are looking for is;
<!--60 Seconds-->
<Connector URIEncoding="utf-8" connectionTimeout="60000" port="8084" protocol="HTTP/1.1" redirectPort="8443"/>
Simply change the value of the connectionTimeout attribute to what you need, restart Apache Tomcat 8 and re-run the script you were trying to execute which was timing out, things should work now.
Happy config!
by Michael Cropper | Jul 25, 2022 | Developer, IT, Networking |
First of all, networking is a challenge in itself to understand what you want to achieve and how to configure things to make them work. It’s made even harder when basic things that should just work, for some reason don’t due to one reason or another. This blog post is off the back of one of those niggles that was driving me crazy trying to understand why something wasn’t working when it should have been and it turned out the answer was pretty simple when I finally got to the bottom of it.
Before we jump into the details, let’s make sure we’re all on the same page.
What is Ping?
Ping is a command line utility that is designed to test the reachability of a hostname or IP address. In simple terms, it’s a way of your computer saying “hello” to another computer and waiting to see if the other computer responds and says “hello” back – or just ignores you.
To use the ping command, it’s as simple as running either of the following commands via your command line either on Windows or Linux and is often packaged on Linux systems through the iputils package from Yum etc.
ping google.com
Which will respond as follows if a successful connection is made
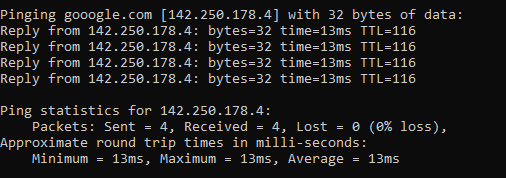
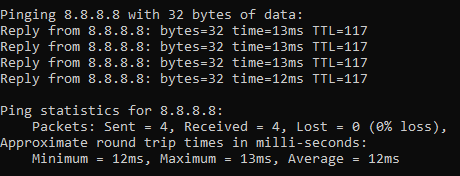
ping 8.8.8.8
8.8.8.8 is the primary IP address of Google’s public DNS system if you’re not aware, with 8.8.4.4 being the secondary IP address. When ping’ed this will respond as follows if a successful connection is made
ping a-website-that-doesnt-exist.com
Here’s what happens when you don’t get a successful response such as when in this example, there is no DNS A Record against that hostname so the hostname cannot be successfully translated into an IP address.

ping 192.168.3.201
Now let’s say that you have a computer on your network that you know exists and you know it is turned on. When you try to ping that IP address, you should receive a successful message as shows above. But in some situations you may get errors such as “request timed out”
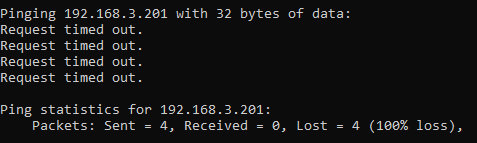
This is where things get a little fun trying to debug these things, which we’ll cover off in this blog post.
Ping Summary
The above various examples are what both success and failure messages look like when using the ping command line utility. So you know what to look out for when debugging why ping isn’t working.
What is ICMP aka. Internet Control Message Protocol?
The ping command line utility utilises ICMP, the Internet Control Message Protocol. I’m not going to go into too much detail with this one as we could go down a fairly deep rabbit hole around the Internet Protocol Suite, IEFT and RFCs (Request for Comments) such as RFC1918 which is the protocol that outlines what IP address ranges can be used publicly and which ones are reserved for private usage. We did a blog post covering what RFC1918 is a few years back to help people understand this in a simple way.
Anyhow, to keep things simple ICMP is essentially a supporting protocol as part of the Internet Protocol Suite that is designed to capture success/failure type messages when one host is trying to communicate with another host. Just like in the examples we gave above using the ping command line utility. The reality is that there are a whole host of protocols that the average technical user has never even heard of unless you’re a network specialist such as: TCP, UDP, ICMP, ESP, AH, GRE, EoIP, IPV6, IGMP, PIM, OSPF, SCTP, CARP, PFSYNC. Most people have heard of TCP, some know of UDP, but the rest most people have never heard of and will never need to know anything about.
In reality, ICMP is used by things that are primarily under-the-hood technologies that most people haven’t ever heard of and/or don’t really care about. The exception being command line tools like ping and tracert/traceroute commands which are designed for humans to be using to help with debugging.
Why all of this is important is because ‘a’ firewall along the journey from source to destination could be blocking ICMP traffic which would cause your ping command to fail, when you would expect it to be working.
Understanding the Route of the Network Packets
Now comes the fun part. While things often seem relatively straight forward that Computer 1 wants to talk to Computer 2, the reality is that things under the hood are 100x more complex than this and have so many nuances and company specific configurations that it’s never as straight forward as it should be to debug basic things like this.
Hence why it’s essential that you understand how things are configured under the hood. Unfortunately in my experience in most enterprise organisations, no-one really has a clue how all this actually works and why it works, it just kind of does for the average non-technical user so organisations kind of accept that because it just works, let’s not to prodding it. Ultimately this is an extremely bad thought process to have and when leadership doesn’t question these things, this ultimately causes endless headaches for IT staff doing their daily work because things that should just work often don’t and often require weeks, even months in many cases of time spent on meetings/emails/conversations to ultimately understand what should have really been a 5 minute fix to a problem.
Even worse in some organisations whereby it soon becomes a case of networking/firewall/configuration whack-a-mole whereby people start fiddling with the settings without understanding things fully which solves one problem but creates 10x more which get reported days/weeks later when other things start to break. This stuff is hard, it requires extremely knowledgeable individuals to make informed decisions to configure things well.
Anyhow, back to the main point. You need to understand how things work. How do packets get from Computer 1 to Computer 2 when you are ping’ing the IP address or hostname?
Let’s look at an extremely basic setup and the hops along the way;
- Source Computer sends ping command to Destination Computer
- Source Computer outbound firewall – Does it allow outbound ICMP traffic?
- Network Router/Firewall/Gateway – Does it allow ICMP traffic through from the Source Computer to the Destination Computer?
- Destination Computer inbound firewall – Does it allow inbound ICMP traffic?
And this is where things get even more challenging, since there can be configurations on Windows such as Public and Private networks that you connect to. Let’s be honest, the average user configuring this on their own machines hasn’t got a clue what to select and just randomly click one of the two options. In reality though, depending on what a user clicks on will depend on how Windows behaves and ultimately in this example if Windows response to ping requests or completely ignores them.
Windows Firewall Public and Private Networks
To keep this section focused on the topic at hand, debugging ping requests not working as they should, we’re going to simply take a look at the two common Windows network settings – Public Network and Private Network.
Your device will either have one or both of these options;
- WiFi Network Interface Card (aka. No cable plugged into device)
- Ethernet Network Interface Card (aka. Cable plugged into device)
And each of these within your Windows Network and Sharing Centre will either be configured as a Public Network or a Private Network. By default on Windows, if a NIC (Network Interface Card) is configured to be used as a Public Network, then inbound ping requests will be ignored, whereas if the NIC is configured to be used as a Private Network, then inbound ping requests will be responded to.
Rather annoyingly on Windows, once this initial configuration is done (in most cases incorrectly…) then changing a NIC from Public to Private or vice-versa is not as simple as clicking a button – you have to use Windows Powershell. There should be no reason to do this in 2022, but hey, send your complaints (aka. “feature requests”) into Microsoft to solve this one.
For anyone needing to do this, here’s how to change a Windows network from private to public or how to change a Windows network from public to private;
- Open Windows PowerShell as an Administrator
- Run command:
- Get-NetConnectionProfile
- Which will show you the network type, i.e. either public or private
- Run command:
- Set-NetConnectionProfile –Name “{NAME OF YOUR NETWORK}” –NetworkCategory Private
- Which will set the name of the network to either Private or Public depending on what you type in the above command
- Then when you open your Network and Sharing Centre, you should see that the network has changed from Public/Private to the opposite of what it was previously.
Norton 360 Smart Firewall Blocking ICMP Ping Requests
Another one of those annoying “features” is when Windows based firewall software overrides the default Windows firewall, adding another layer of debugging to a problem. In this case, software such as Norton 360 Smart Firewall essentially takes control of the firewall management rather than Windows out of the box. This is where things can get messy.
End user firewall software, regardless of brand, tend to dumb things down to such as level that they often hide the complexity of the details which are often hard to find in the system. Norton 360 is a prime example of this. By default it blocks inbound ICMP traffic, meaning that if you are trying to ping Computer 2 (with Norton 360 on) from Computer 1, then by default pings will fail. You need to allow ICMP traffic within the Norton 360 Smart Firewall settings to ensure that this traffic can pass through to Windows to respond successfully.
You can see here how deep the settings for this are buried within Norton 360 Smart Firewall, it’s almost impossible to find this without knowing exactly what you are looking for, which 99.9% of users simply haven’t got a clue about.
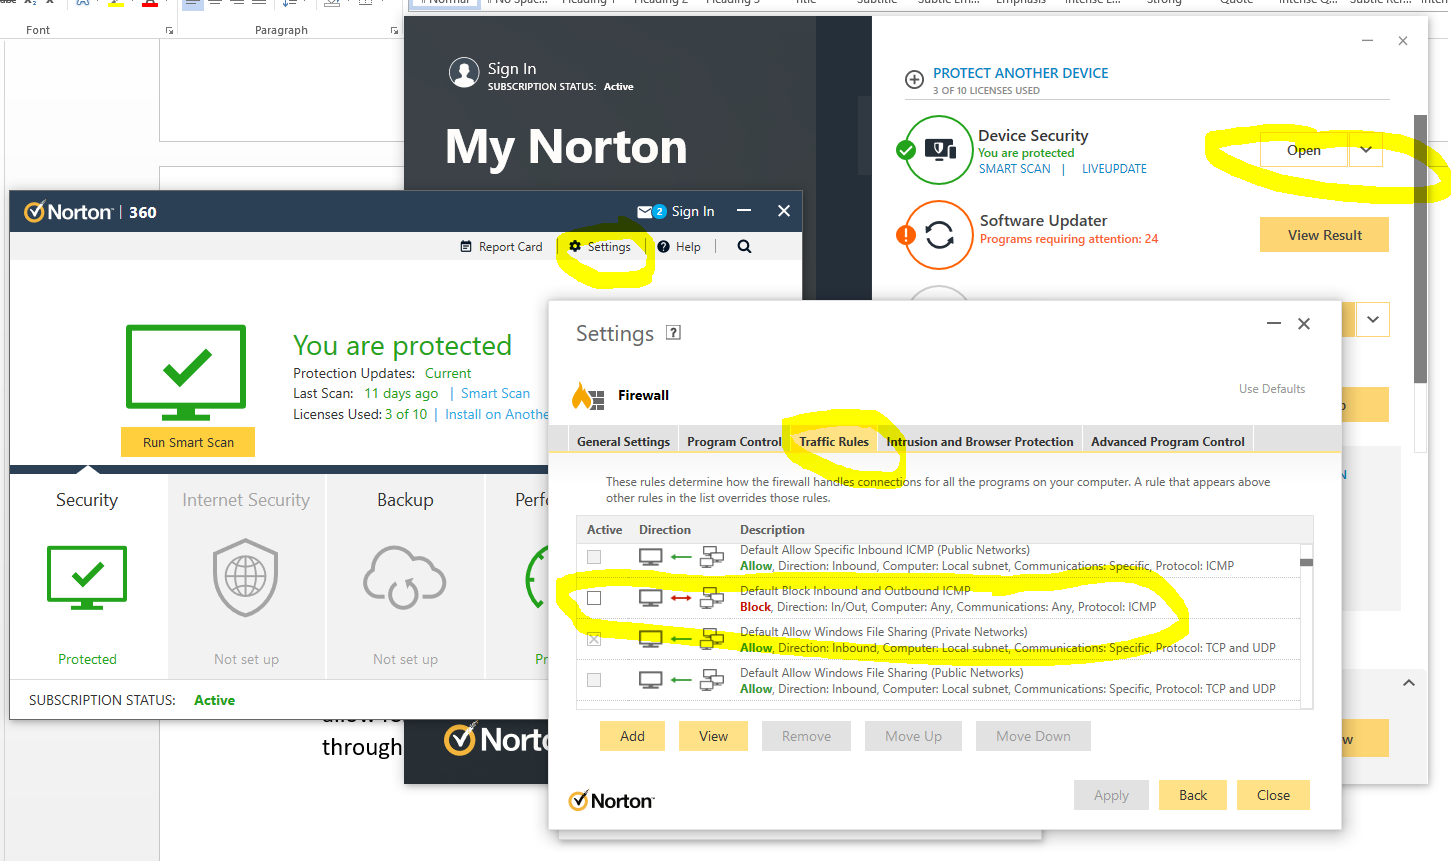
The irony being that there is nothing “smart” about this setup, it’s simply fully of dumb assumptions being made in the guise of security. These kinds of configurations are an absolute pain to deal with as they are never well documented out of the box about what is the default configuration, which ultimately results in people digging and digging and digging to get to the root cause of why something that should be working isn’t working. Hey, the joys of IT I guess. It does annoy me though around all these assumptions that are made by software vendors to try and “help”. The best help they could give is write better documentation and/or build their software in a way that caters for different types of users from basic to power users and documentation that helps even the most computer illiterate individual understand what they need to configure. Most companies don’t seem to get this basic concept though, unfortunately.
Summary
I hope that this blog post has given you some guidelines and thoughts about how to debug and troubleshoot issues when commands like ping and tracert/traceroute aren’t quite working as expected. What you’ve hopefully picked up is that these things aren’t straight forward to debug.
The best advice I can possible give is to be methodical at every step along the way. Aim to understand every hop along the journey, and confirm for every hop that traffic is successfully leaving the hop and successfully arriving at the next hop along the way.
It’s not straight forward and requires an exceptional understanding of the underlying infrastructure, which often isn’t easily accessible particularly within enterprise organisations. It’s not easy debugging these kinds of things with every hand/arm/limb/sense tied behind your back.
by Michael Cropper | Jul 3, 2022 | Developer |
Webhooks are a very interesting topic, but they are often misunderstood by both technical and non-technical people alike. The reason they are misunderstood is often because depending on who you ask or what system you are looking at, each often has their own slight variance on what they actually are and how they are used.
I often head phrases such as “a Webhook is just an API isn’t it?” Well, no, not quite. And “Why do we need Webhooks when we can just poll a system for changes?” Webhooks are a complex topic to understand well, but fundamentally they are actually really basic things.
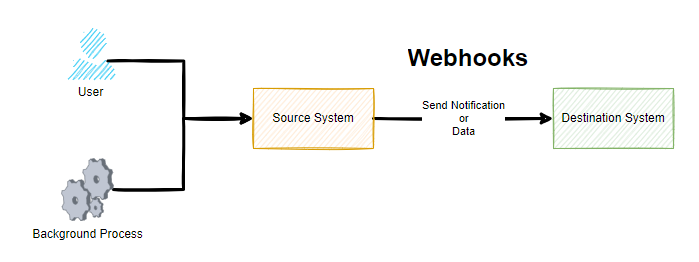
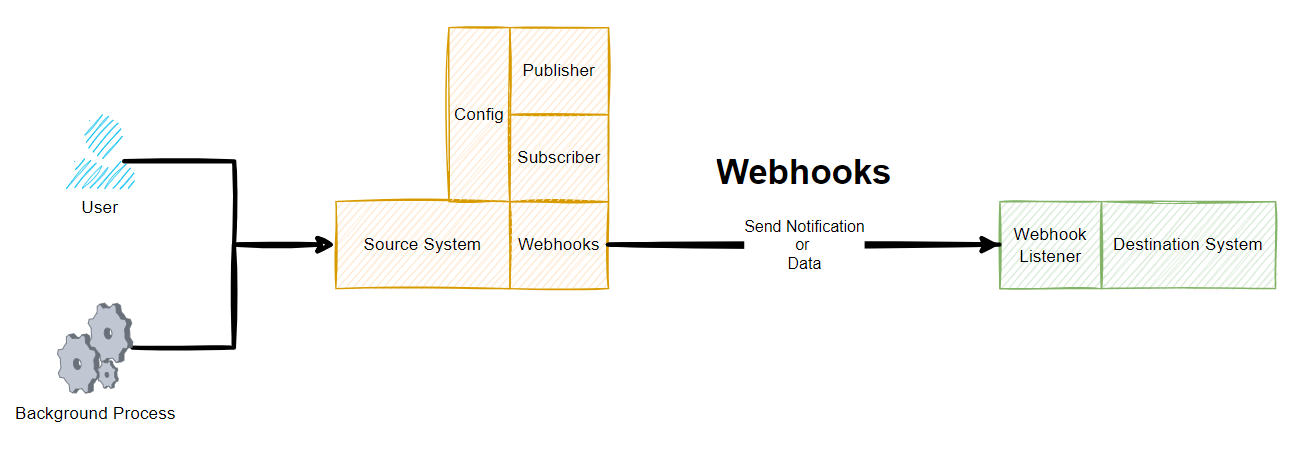
A Webhook is simply a term used for when something happens in a Source System that it will send a notification or data to a Destination System. Conceptually, there is nothing much more to it than that.
Sounds simple when you put it like this, right? Well, yes, and it is that simple at least at the conceptual level. As always, the devil is in the detail. Webhooks are commonly described as user-defined callbacks.
As you can see in the above diagram, whenever either a User or a Background Process / System Event happens, this means that the Source System sends a notification or data to a destination system. But how you may be thinking. Well, we’ll come onto that in a little while. For now, just keep this basic concept in your mind for what Webhooks are.
When Should I Look at Webhooks?
There are many reasons you want to look at Webhooks and this type of technology, often it is when you want to something to happen in one system off the back of something happening in another system.
For example, some common use cases of Webhook technology is when a customer on an ecommerce website makes a purchase using a payment gateway. When this happens, the payment gateway needs to inform your website that the payment was either successful or it failed as you want to make sure the customer has paid before you go sending the goods out to them. Or another common use case is when you have a master system of record for certain types of data and you want to ensure this data is replicated in another system which is quite common in enterprise organizations to ensure a user doesn’t have to log in to 10x different systems to do their day job.
You may also want to start to look at Webhook technology when you are integrating systems together or you may have a legacy integration in place with either CSV files flying around and/or what I like to call Nagging Integrations, whereby System A will continually poll System B asking if there has been any changes that it needs to be aware of. These types of integrations are extremely inefficient, particularly if data only changes say once per hour and your integration is asking if anything has changed once per minute. These types of integrations are wasteful.
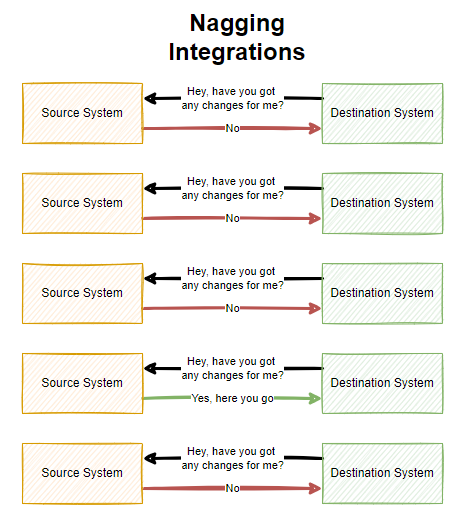
As you can see above, there is a lot of waste with Nagging Integrations which poll a system on a regular frequency. All of this needless additional load can result in your applications being less performant and require more infrastructure resource to power because of this inefficiency which can have a cost implication.
Why Webhooks are Awesome
Many legacy integrations are simply either too slow, too dumb or a mixture of both. This is why Webhook technologies are so awesome. Webhooks are real time data and notification transfers to get data moving throughout an organization to where it needs to be. That means, no more batch jobs or overnight data loads slowing an organization down.
With technology first systems, you will often find that Webhook technologies come out of the box and are configurable to what you need so you can design your data flows efficiently throughout your enterprise organization. The reality is though, many systems aren’t built in this modern way to enable this capability, so don’t expect everything to support this type of technology.
I should also clarify, that Webhooks are a concept, it’s not something you can purchase and plug in to your existing systems as they need to be built into systems from the core. We’ll come on to this bit a little later in this blog post.
Who Uses Webhooks?
I’ve already mentioned a few example earlier around some common use cases for Webhooks being either ecommerce and payment gateway related, or getting data moving around an enterprise organization in real time. You’ll find that a lot of SaaS (Software-as-a-Service) companies will have some form of Webhook technology baked into them.
In some cases, there are even entire business models and SaaS companies that have been built to piggy back off this technology. Companies such as IFTTT (If This Then That) and Zapier have a suite of tools in their systems which are powered through Webhook technologies under the hood to get notifications and data moving to where it should be.
Where Can I Use Webhooks?
As for where you can use Webhooks, well, this all depends on the software and systems that you are working with. In my experience, the majority of historical legacy system simply won’t have any kind of Webhook type technology to use for integrations. You’ll often be lucky if they have APIs available in some way or another.
You tend to find that Webhook technology will sit in the bit companies, the SaaS tech first companies. The bigger the company you tend to find that the Webhook technology is more configurable within their system whereas some systems only have basic levels of customization in place.
It all depends on your use case. When you want to look at getting data moving from one system to another, Webhooks are often the first choice due to how efficient they are. So do your research on the systems you are using to understand their capabilities.
If you look at modern SaaS applications that technology first organisations use on a daily basis, all of these come with Webhook technology built in;
- Stripe
- Paypal
- GitHub
- Jira
- Salesforce
- Microsoft Business Central (aka. Microsoft Navision in older terminology)
- SAP
- Microsoft Teams
To name just a very small handful examples that you are probably familiar with. What is interesting to note is that even between the above systems there are often slight differences in terminology and capabilities depending on your individual use case.
How do Webhooks Work?
So now, onto the good bit for how Webhooks work. All of the above has been explained on a fairly high level of what Webhooks are and how they work. Now, we’re going to take a deeper dive into Webhooks so it’s clear how they work as they are no-where near as simple under the hood.
To help keep this bit as simple as possible, let’s break this down into a couple of core sections;
- Source System
- Destination System
Fundamentally Webhook technology uses the Publish-Subscribe architectural design pattern, whereby one system publishes something and another system(s) then subscribe to that event so they get notified when something happens that they care about.
Google actually created PubSubHubbub (Best name ever for a platform!) quite a few years ago with the aim to synchronize content from many different RSS feeds into a handy platform for content. It never really took off unfortunately, likely due to the demise in the use of RSS feeds generally as social media platforms pretty much got the attention of users. So Google open-sourced their implementation of the concept Webhook technology in 2017 which is called WebSub and designed it as a protocol for communication as a way to standardize how these things work.
What is important to note though, Webhooks are a concept of sending data from one system to another in a real time and even driven way. PubSubHubbub and WebSub are just one implementation of this, and in my experience, most software vendors create their own implementations of Webhook technology based on the specific details of what they want to achieve and how they want to go about doing it. In practice, there is no one size fits all so companies often build these things how they see fit, some of which are configurable and others aren’t etc.
To extend the original diagram from earlier, this is more like what a Webhook really is when you look at it end to end;
Source System Webhooks
Ultimately a source system is just a bunch of code under the hood that teams of software engineers have been crafting for many years to build the product that you see and use today. Fundamentally these systems have a core data model behind the scenes too. To keep things simple as an example, imagine the source system stores basic data about a company in different related data objects;
- Company
- Company Stores
- Company Contacts
The next step is to ensure the system is coded in a way that can ensure that when data changes for these different data objects that an event is captured, aka. published, which can then be subscribed to by another system.
Depending on the system in use, this may be a hard coded approach to sending data to another system and this can be absolutely fine in many scenarios despite the negative connotations with the word hard coded. In more advanced technology first SaaS platforms, this kind of thing generally has a user interface designed to allow a user of the system to configure what they want to do and when etc. These two different approaches involve vastly different amounts of effort to build, so in many cases this is an evolution of time to get the system more configurable and less hard coded, but this is all dependent on use cases.
Then when it comes to the implementation, there are additional nuances to consider. Do we queue the messages, or do we send and forget in real time? What about retries if a message doesn’t get through, do we care if something fails or do we implement a FIFO (First In First Out) message queue to ensure we have the visibility that something has been successfully sent etc.
What about logging, when things go wrong we need to understand why etc. Even with some of the big players mentioned earlier, not all of these concepts are built into their systems yet that can be accessed by a user.
What about the order of execution, is that important? Well, yes in a lot of cases it is to ensure that the updates are processed in the correct manner and the latest update is an accurate reflection of the state of the data. In other cases, the order of execution may not be important at all as it is a simple notification that something happened and when you click through to see the details that has the most up to date information. All of these things need to be considered.
Destination System Webhooks
This is the part that is often forgotten when it comes to Webhook technologies. Just because a Source System can send out a message to a Destination System this isn’t the end of it. What does the Destination System do with the message? Does it even understand the message? This is where things can get complex.
Fundamentally a Webhook is essentially built up of the basic building blocks;
- URL – Where the message should be sent
- Payload – What the message is, usually sent in JSON
Then it is up to the Destination System what to do with this message. And this is where the other half of the complexities lie. This is what is generally referred to as a Webhook Listener. There is no real difference between this terminology and that of a standard API which is basically doing the same thing when data is sent into it using a POST Request.
What the Destination System chooses to do with this message is up to itself. What HTTP Status Code should be sent?
- 200 OK
- 400 Bad Request (aka. I’ve no idea how to interpret your message)
- 401 Unauthorized (aka. you are not authenticated so you cannot access the system)
- 403 Forbidden (aka. you are authenticated but you don’t have permissions to do what you are trying to do)
Ultimately how the Destination System behaves determines if the Source System is happy that the message has got through or not.
Summary
Overall, I’m sure you can see that while Webhooks seem fairly straight forward conceptually, when you get under the hood they can be extremely complex beasts. This complexity from many of the big SaaS providers is often abstracted through the use of marketplaces and plugins where apps or connectors or whatever they like to call them do the translation between the systems to ensure the right message gets through when it should. And likewise there are often user configurable features within modern systems that allow you to easily add/edit/remove configured Webhooks to suit your needs at that point in time. Some systems are more/less configurable than others, so keep this in mind.
Webhook technologies are seriously powerful tools when implemented well. The reality is that they are difficult to build when you are designing a platform that requires this technology embedded into it. As a user of Webhook technologies, you’ll find this technology extremely beneficial in a wide range of use cases. As a software engineer involved with designing and building the system architecture for Webhook technologies, well, this needs a lot of thought to get right and to continually evolve to meet the ever growing expectations from users.
by Michael Cropper | Aug 31, 2021 | IT |
BIOS boot modes, something that is so long standing in the IT industry which never changes, it had a single option which was the BIOS boot mode. The usual blue screen that only works with a keyboard and not a mouse, the blue screen that you have to access from the black screen on boot usually by repetitively tapping on either the F10, F2, F12, F1 or DEL key, depending on your motherboards manufacturer. Simple right? No. It’s an absolute nightmare.
But hey, we’ve got a newer and upgraded version of BIOS, and it’s called UEFI. UEFI was actually launched officially as a standard back in 2006 believe it or not. The time from when a standard is launched vs how quickly this moves throughout the IT hardware manufacturers is often measured in years, not months or days. So actually this is a fairly ‘new’ thing and many consumer hardware manufacturers only started to phase this technology into their systems around 2017.
The whole point of UEFI is the concept of Firmware-as-a-Service which is focused around extensibility rather than fixed approaches. What this means is that UEFI is designed to allow the utilisation of large disk partitions of over 2TB in size along with a modular design which enables both backwards and forwards compatibility.
Fundamentally the difference between BIOS and UEFI comes down to the link between the hardware and boot loader layer on your drives and bootable devices connected to your system. Think of this kind of like the ‘Construct Program’ in The Matrix – you can load whatever you want, given the constraints of the system.
In the real world what this means is that traditional BIOS systems are based on a more simplistic limited memory/capacity systems of computer chips. Whereas UEFI is capable of operating on systems that have more advanced hardware chips within their systems. Hardware and software are intricately linked. UEFI stands for Unified Extensible Firmware Interface.
One of the huge benefits from a user perspective is that within UEFI you can actually use your mouse to control the system rather than everything being keyboard driven in the Legacy BIOS system. Beyond that, you are probably never going to need to worry about these differences – that is until something doesn’t work as you expect in relation to a piece of hardware not booting correctly. This is where things are a bit messy and it’s going to take likely another decade until things fully iron their self out.
As a general rule of thumb, for modern hardware, just use UEFI to Boot. For older hardware or older operating systems, you may have to use Legacy Boot to get the machine to boot up successfully.
Rather than re-invent the wheel, here is a handy source of the core differences between Legacy Boot mode and UEFI Boot mode;
What is a difference between UEFI and Legacy Boot settings;
- Legacy is traditional and very easy method which had worked absolutely fine so far.
- UEFI is critical, 1709 was the first perfect OS which worked best with the OS.
- Legacy has best in performance had minimum boot issues and easiest to install.
- UEFI is now stable, but yet most of the IT tech do not now how to use this feature and correctly install the OS.
- Legacy was safe and secure and very user friendly, it is just that you can select the boot device which you want to boot from and it search for Master Boot Record MBR and used to pick it up.
- UEFI is market as more secure but there is no more security just that it supports TPM which enables Bitlocker and has extra headache to mention the EFI boot manager, which is no secure if you have access to BIOS and did it few times earlier just like Legacy.
- Legacy has maximum partitioning size of 2 Terabyte.
- UEFI has partitioning size of 9 Zetabyte which is huge.
- Legacy can have 4 Primary Partition.
- UEFI can have 128 Primary Partitions.
- Legacy is good for loading 2 OS on same system.
- UEFI is Great for loading more than 2 OS on the single system.
- There are more differences and UEFI is way beyond the Legacy BIOS technology but it has not yet revealed its troe power.
- Legacy uses Master Boot Record.
- UEFI uses GUID Partition Table.
- Legacy is traditional Firmware which interacts with Motherboard and OS.
- UEFI is also just a Firmware with advanced options.
- Microsoft New OS will no more support Legacy they have transformed now.
- Microsoft stop support for Legacy OS after launch of 1709 WIndows update.
- The last best Hard Drive supported by Legacy BIOS is SATA SSD.
- The Last Best Hard Driver supported by UEFI is M.2 PCIE SSD Hard drive which does not work on Legacy BIOS.
- Legacy Supports the SSCM in traditional way like you can enable PXE boot and select option to Boot From Network through LAN.
UEFI also supports and enable options to boot from traditional network which is IPV4 as well as IPV6. UEFI firmware is keeping all possibility of future options. To enable it you need to enable UEFI Network Stack which will give option for IPV4 and IPV6.