by Michael Cropper | Nov 18, 2013 | SEO |
If you keep a keen eye on Google Analytics (and you should be doing) then you will have noticed a significant change taking place recently with the change in how organic keywords are being reported. Previously it was possible to see exactly what a user searched for on Google before they arrived at your website as can be seen below;
Google Analytics Keywords
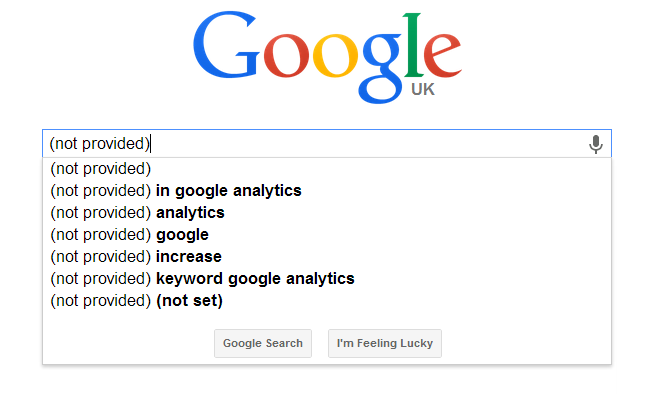
Now you may notice that the majority of your keywords are being listed as (not provided) which isn’t that useful at first glance as it looks like all of the useful data has gone missing.
Google Analytics Not Provided Keywords
There is no way to retrieve this data now that the change has happened, so we’ll take a look through a few other ways of finding out similar data.
So what is (not provided)
Since October 2011 Google has been steadily rolling out secure search for users. Secure search is when people are searching on https://www.google.com opposed to http://www.google.com (notice the ‘S’ in the first bit of the URL, this stands for Secure).
The first step Google made to masking keyword data as (not provided) was when they automatically switched users to secure search when they were logged into a Google product (Gmail, Analytics, Chrome, YouTube, etc.). As more users continue to use Google products, more of your customers began to be included within the (not provided) bucket.
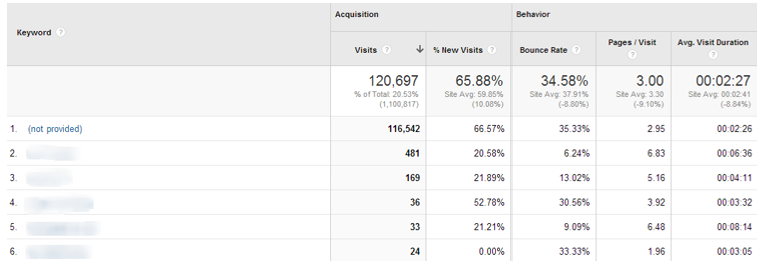
Over the past two years, this has continued to grow and has recently increased to almost 100% for many websites.
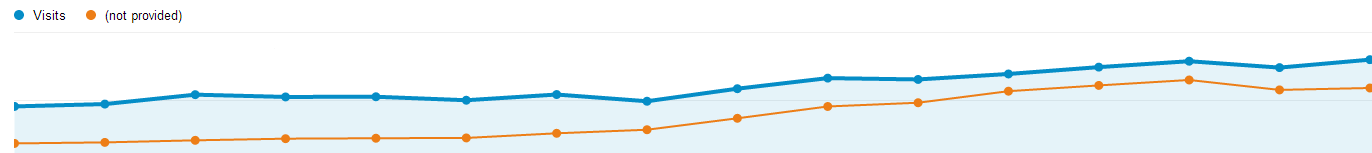
Google Analytics Rise in Not Provided Keywords
When did (not provided) suddenly jump
The percentage of (not provided) traffic from organic search has been steadily increasing since October 2011 when it was first introduced. More recently in early October 2013 the percentage hugely increased and is often now nearly 100% with many websites;
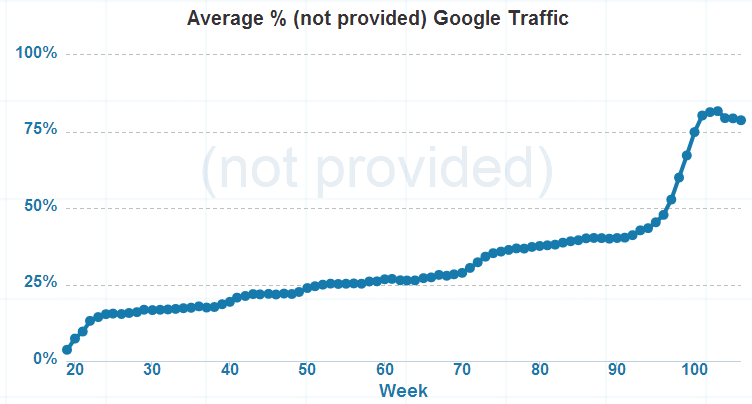
Overall Rise in Not Provided as Percentage
This change happened when Google made the switch to default users to secure search when searching on Google. This change to secure search for most people means that keyword data is now being reported as (not provided) within Google Analytics.
What we have lost
Previously reporting on Search Engine Optimisation work was straight forward, you could tell exactly how much traffic was coming to your website from specific keywords which you could then link back to any work that was completed to improve the keyword rankings and traffic for those keywords. This is what we have lost, the granularity. As the majority of keyword data is now being reported as (not provided) then this means that it is not possible to look at such a detailed level about what keywords people used to find your website. That being said, this isn’t necessarily a bad thing.
While this granular level of reporting has disappeared and isn’t ideal, this change is actually forcing companies to focus on the important metrics when it comes to optimising their website which is good. We have always focused on the important metrics for our clients which are traffic, conversion rates and revenue levels. The change in (not provided) keyword data is actually forcing businesses to look at these metrics too, instead of focusing on individual keywords and vanity ranking metrics.
Tracking the important metrics
As mentioned above, the important metrics to monitor for your website are traffic levels, conversion rates and revenue figures. When businesses are focused on these important metrics, the detailed specific data which has now been lost isn’t such a huge disadvantage. As long as traffic levels are increasing which is leading to increases in revenue then this can provide accurate reporting for Search Engine Optimisation efforts.
Focusing on Customers, not Search Engines
Real Search Engine Optimisation work is all about focusing on your customers & potential customers, providing them content that is useful and engaging. This work doesn’t rely on being able to see the individual keywords your customers are using to find your website, it comes from knowing everything about customer needs. As mentioned earlier, this change is good for this exact reason. Previously businesses have been far too focused on specific keyword rankings and traffic on specific keywords instead of focusing on what their customers actually want. This change is helping shift the focus back towards customers.
Tracking branded & non-branded traffic
Previously tracking branded and non-branded traffic was as straight forward as filtering organic traffic based on what people searched for. For example if someone searched for “Contrado Digital” then this is clearly a branded search so they already know about the brand. Anyone who searched for something more generic such as Search Engine Optimisation Blackburn, then this would suggest that they may not know about the Contrado Digital brand at present, so this is a good opportunity to drive new customers. This is no longer possible with the rise of (not provided), which leaves us with a change in how to understand website visitors.
Often branded search queries will land on the homepage of your website, meaning that we can now use this as a new way to classify branded and non-branded search queries. What I would suggest here is to check what this looks like for your individual website as it may be that branded visitors land on various pages throughout your website. Thankfully the data is still available within Google Analytics from prior to the change, so this is easy to break out and check how your customers behaved prior to the reporting change.
What we have found across a range of industries is that often the majority of branded search traffic does land on the homepage which makes it easier to monitor non-branded search traffic, since they land on other pages through the website.
With this change we would recommend reporting on organic traffic as follows;
- Branded organic traffic: Visitors landing on the homepage from search engines
- Non-branded organic traffic: Visitors landing elsewhere throughout the website from search engines
This new classification of branded and non-branded traffic can help to fully understand how things are performing over time.
Why has Google made this change
The official reason Google has given behind this change is due user privacy although this doesn’t quite stack up as the keyword level data is still available within Google AdWords. This suggests that Google is trying to push more businesses to use the AdWords platform to gather this additional data about what keywords users are searching for. We may never know the real reason behind this change, although it is going to be interesting how this develops over the next 12 months.
Who has this change impacted?
In summary, everyone. Everyone who uses Google Analytics and other web analytics packages has been impacted by the (not provided) change at the same time. Unfortunately there is nothing that anyone can do at present to retrieve this data so it is important that businesses adapt to this change to look at new ways of reporting on results.
Alternative data sources
While the data may have disappeared from Google Analytics, there is some data still present within Google Webmaster Tools. While this data is no-where near as accurate as Google Analytics, it can help provide a guide as to what keywords visitors are searching for before landing on your website.
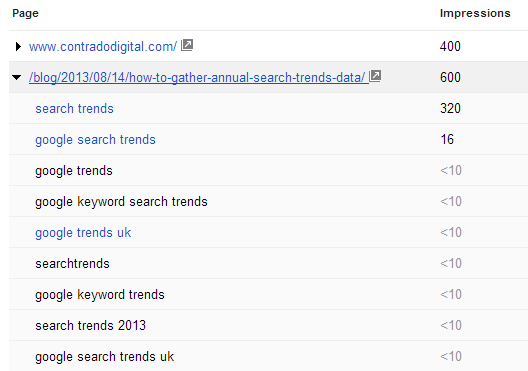
Google Webmaster Tools Search Query Data
Google Webmaster Tools can certainly still provide content ideas and good estimates about what search queries customers searched for prior to seeing your website within the search engine results pages. It will be interesting to see how this reporting develops over time as Google may add in additional data here.
Understanding the whole user journey
Often businesses will simply look at the conversions and traffic levels from an individual website visit from different traffic sources. Honestly though, think back to when you booked your last holiday, did you – in a single session – go to a hotel booking website, find the exact hotel you wanted in the exact location and book there and then? No, I didn’t think so. The whole user journey takes time.
First you start of researching holiday destinations on various websites. Then you research holiday packages or different hotels available, again on different websites. You may then want to discuss the options with your partner or family another evening when you have the time. So you may then come back to the website again in a few days to actually purchase your holiday.
The way that Google Analytics tracks conversions and revenue levels by default is using ‘Last Click Attribution’ which in basic terms means that a user clicked through to your website, then purchased during that same visit. The example I have just outlined above though shows that this is often not how customer behave.
Introducing ‘Assisted Conversions’. Assisted Conversions within Google Analytics report on what you would imagine, they show which traffic sources (organic, paid, referral, direct) are contributing towards new revenue. Below shows the number of conversions who first arrived at the website through organic search and later converted on a subsequent visit;
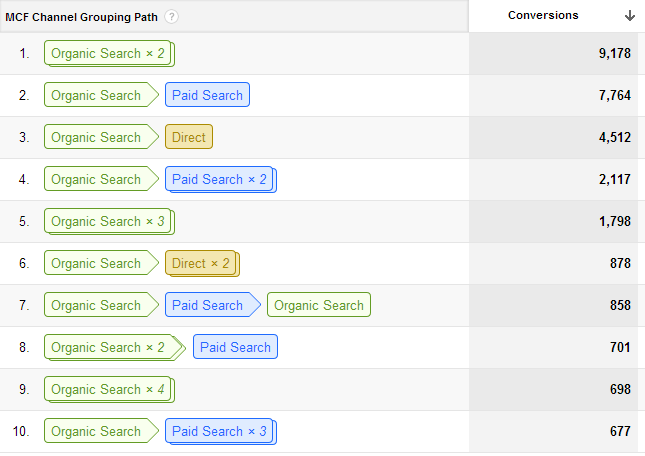
Google Analytics Assisted Conversions Data
As you can see in the image above, customers often visit the website multiple times prior to converting, and from multiple traffic sources. This again needs to be a key focus to accurately reporting on results from Search Engine Optimisation work.
The assisted conversions data is extremely powerful and can really help you to place a more accurate return on investment figure towards your marketing spend on different channels.
Summary
Hopefully this helps you understand all about (not provided) and how this change needs to be adapted to so you can report accurately on results for your business. If you have any other questions about (not provided) then leave a comment.
by Michael Cropper | Oct 31, 2013 | SEO |

Where: Media City UK
When: 29th October 2013
The #SocialMediaWhatsTrending event held at Media City UK was designed to gather industry experts together and look at ways where social media is changing the way people connect with businesses. The BBC Academy College of Journalism and BBC North designed the conference to bring together practitioners in journalism and content making from the digital world.
I’m sure a lot more people would have liked to attend the event, so hopefully we can cover some of the main bits here. Throughout the day there were two lots of sessions running. I was in the main session throughout the day so if anyone attended the breakout sessions, then please leave your feedback on those in the comments section.
Session 1 – Online Privacy, Freedom & Security (in the Era of Transparency)
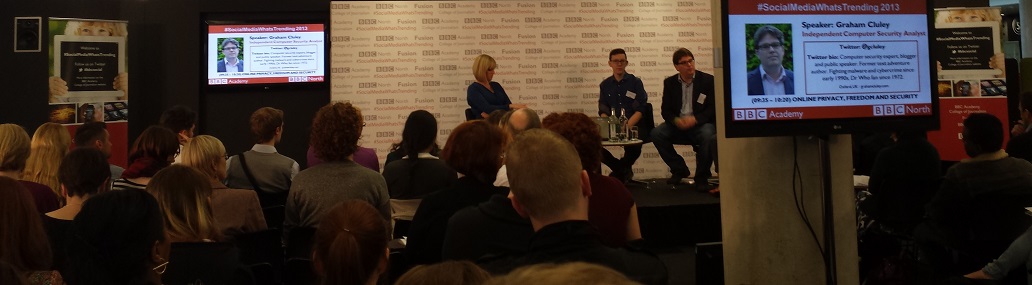
The first session was chaired by Stephanie McGovern, the BBC Breakfast Business Presenter, with the panellists including; James Ball, The Guardian Data Journalist, Graham Culey, an Independent Computer Security Analyst along with Martha Gill, Journalist at The Telegraph and New Statesman.
Overall the session was really insightful, especially to find that The Guardian only receives around 1.5 – 2% of their traffic from Twitter. James Ball made a good point about how journalists are in a difficult situation since on one hand it is extremely important to protect their sources, although with the increasing usage of new technology this can lead to you compromising your sources without even realising.
Session 2 – Editorial Leadership, Social Media & Breaking News
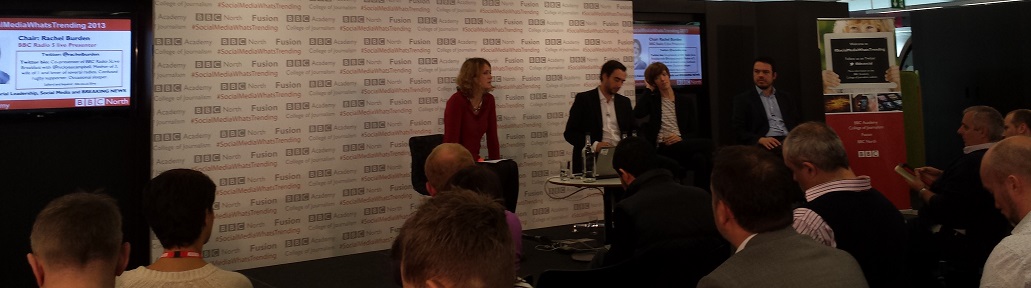
The second session was chaired by Rachel Burden, BBC Radio 5 Live, with the panellists including; Anna Doble the Head of Online at Channel 4 News, Tim Gatt the ITV News Digital Output Editor along with Chris Hamilton the BBC News Social Media Editor.
Throughout the session, Tim Gatt gave a fantastic insight into the performance of the ITV News website which gets over 4 million visitors per month, 50% of which is from Twitter and Facebook. In addition, he revealed that ITV Evening News gets between 4 – 6 million viewers per night.
After which, Aziz Rashid the Head of BBC North West pointed out that this is beaten by BBC Regional News every night. Not that it is a competition…
Anna Doble gave an interest insight into how the Channel 4 News Google+ followers are actually far more engaged with Channel 4 compared with other social channels. This is an interesting topic since it was also debated at another session as to which is more important, a high number of followers or a highly engaged but lower number of followers.
Chris Hamilton is quite excited about the future of Facebook, particularly with the introduction of the Facebook Insights API and Graph Search. If you aren’t sure what they are, in short, the Facebook Insights API allows developers to pull aggregated demographic information from Facebook which can be used to better understand your audiences. Likewise, Facebook’s Graph Search allows users to easily find people who are interested in different topics, as an example you could search for “Developers in Blackburn who like Star Wars”. Ok maybe that is a bad example, as I’m sure that would include most developers, but hopefully this highlights what this is. The point Chris was making is that this really does allow businesses to find trending information that is happening right now, which has previously been left to the realms of Twitter.
Session 3 – Flagship Entertainment “Capturing the nation” – The Battle for the Biggest Audience
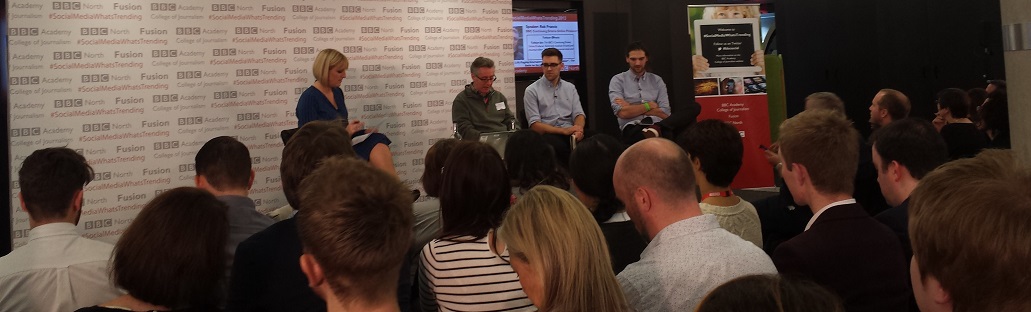
The third session was chaired by Stephanie McGovern the BBC Breakfast Business Presenter with panellists including; Rob Francis the BBC Continuing Drama Online Producer, James Cooper the X-Factor Senior Interactive Producer and Thom Gulseven the Channel 4 Senior Online Producer.
This again was an insightful session with interesting findings about the X-Factor around website traffic. James mentioned that while the website traffic from traditional sources was decreasing, this was being replaced by increases in traffic to the website which is being fuelled by the X-Factor 5th Judge App which has been downloaded more than 1 million times.
When James was asked if the 5th Judge App was leading to less people picking up the phone to vote, he didn’t have the figures. Although he did say that they are introducing a pay-in-app option, which one can only infer that this is the case and X-Factor are aiming to increase revenue via the mobile app.
The topic of engagement VS follower numbers came up and while Thom Gulseven would prefer a much more engaged audience on social channels, James believes that the large number of followers is still vitally important especially from a commercial point of view. Ultimately advertisers want to know how many people are going to be seeing their branding messages.
Another interesting piece of data that Thom mentioned was that around 50% of viewers watch Made in Chelsea ‘On Demand’ which is a staggering amount. This really does just show how the behaviour is changing for how people consume content. This leads nicely onto the keynote speaker of the day, Ben Cooper who talked about the shift away from different devices towards providing content on ‘All Screens’ at times when people want to watch things.
Session 4 – Keynote Speaker – All Screens
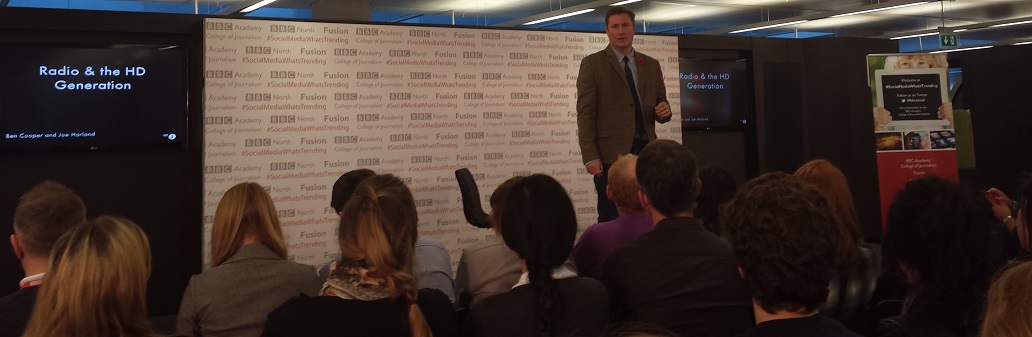
The keynote speaker for the day was Ben Cooper the BBC Radio 1 & BBC Radio 1 Xtra Controller. Through his talk he really emphasised the importance of knowing your audience and what they want. This understanding is changing the way content is being created at the BBC and how it is then shared with the world.
One example Ben gave was how they have added an extra dimension to radio by adding 6 cameras per radio studio which is allowing them to create even more content with little extra effort involved. This extra dimensions is paving the way for engaging with different audiences who may not have listed live to a show previously. An example of this was the recent interview with Kanye West which has been viewed on YouTube over 1.5 million times within the space of 6 weeks since being uploaded.
One really interesting point mentioned is about how the BBC are looking to incorporate Radio 1 into the iPlayer platform instead of using YouTube. This is really interesting since this is starting to move the power of short form video away from the Google owned YouTube platform back to the BBC.
As part of the ‘All Screens’ topic, Ben mentioned that 33% of people use music streaming services simply because they can access them via a mobile device. Around this topic, there is always the debate if music streaming services are going to replace radio and Ben simply doesn’t believe this to be true. Radio has much more of a personality and allows listeners to connect with the presenter at a level that streaming services simply can’t offer. What I believe will be interesting in the future is how the two of these merge together. Are we going to start to see more homemade live streaming radio stations curated by amateur DJs which can build up a following of their own – all powered by a streaming service in the background? It is going to be interesting to see either way.
A few other interesting facts about Radio 1 is that the website gets approximately 3 million unique visits per week, the YouTube channel is the most popular radio station on YouTube with over 680,000 subscribers along with a fact that 9 people every second are watching a Radio 1 video on YouTube. On top of this, 10.8 million people listen to Radio 1 each week for an average of 6 hours. Ben mentioned that this is down from a previous average of 12 hours per week, but I would question if this is simply because audiences are simply consuming the content in different ways and the BBC hasn’t managed to integrate these new data sources to fully understand how people are consuming content.
Session 5 – Investigative Journalism & New Technologies
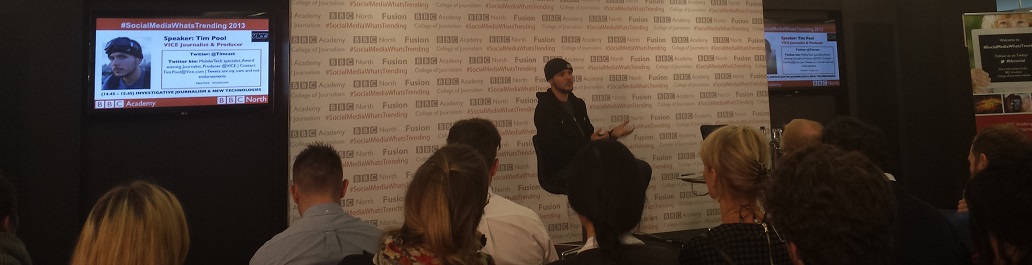
The next session started with Tim Pool, a VICE Journalist and Producer who is really breaking the boundaries of journalism by using new and exciting technologies. These technologies include live video streaming, Google Glass and drones with video camera attached.
An interesting point made by Tim is how he has had to use this technology in the past to get past the police who were blocking him from legally filming. The situation he described was how the police were lined up in a row blocking journalists’ access to an area so they couldn’t film. This is where the use of drones came in, Tim simply flew a drone over the police to start filming what he was legally allowed to.
Following on from Tim was a panel chaired by Cat Lewis the CEO and Executive Producer at Nine Lives Media with panellists including; Ian Katz the BBC Newsnight Editor and Alex Miller the VICE UK Editor in Chief. Throughout the discussion it was interesting to hear about the different rules that each company needs to follow along with how online criticism is dealt with.
On the BBC side, everything has to follow extremely strict guidelines whereas at VICE, things are a little more relaxed which allows them to put an interesting twist on their reporting. Due to the different approaches, the way criticism is dealt with also changes. If a slip is made by a BBC presenter then the usual ‘we are very sorry’ comes out, whereas if a similar thing were to happen with VICE, then this would be a more relaxed approach and often the readers would understand that actually, what was said wasn’t said in a negative light.
Session 6 – Sport, Social Media & ROI with Audiences
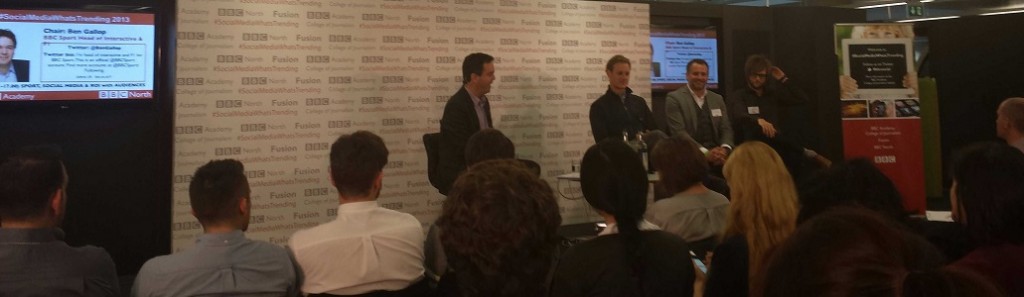
The final session of the day was chaired by Ben Gallop the BBC Sports Head of Interactive & Formula 1 with panellists including; Scott Davies the VP EMEA of Never.no, Chris Nield the Social Media Executive at Manchester City FC along with Dan Walker the BBC Sports Presenter.
This final session raised some interesting points about how to handle trolls online, with the panel having different methods of dealing with this. One can simply ignore the trolls and get on with your day, whereas others have found that retweeting hate messages to their followers allows their followers to deal with the problem on their behalf. There is no sure fire answer here to the problem trolls cause online, so I’m sure we are going to see a lot more debates about this topic in the future.
An interesting statistic from Ben Gallop was that 40% of all tweets are about sport. I’m not sure where that figure has come from and it isn’t one that I am sure is 100% correct. I have found a study that 40% of tweets are ‘babble’, which depending on how you read that could be sports or not.
Ben did go on to say that the BBC Sports website is the largest in the UK in terms of audience and that around 4 – 5 million people watch Match of the Day each week. On a social media point, it was interesting to find out that approximately twice as many people are tweeting about Match of the Day compared to Strictly Come Dancing, even though Strictly has double the audience. This again comes down to the point raised earlier about engagement.
Dan Walker gave an interesting insight into how they managed to interview Mario Balotelli. He notoriously doesn’t do interviews with people, although Dan found out that he was a huge fan of Noel Gallagher and that Noel also liked to dedicate a song to Mario at different gigs. It took 6 months to plan but eventually Dan managed to organise an interview of Mario with Noel. This just goes to show the importance of creating unique and engaging content and that it takes time and effort to do this.
Summary
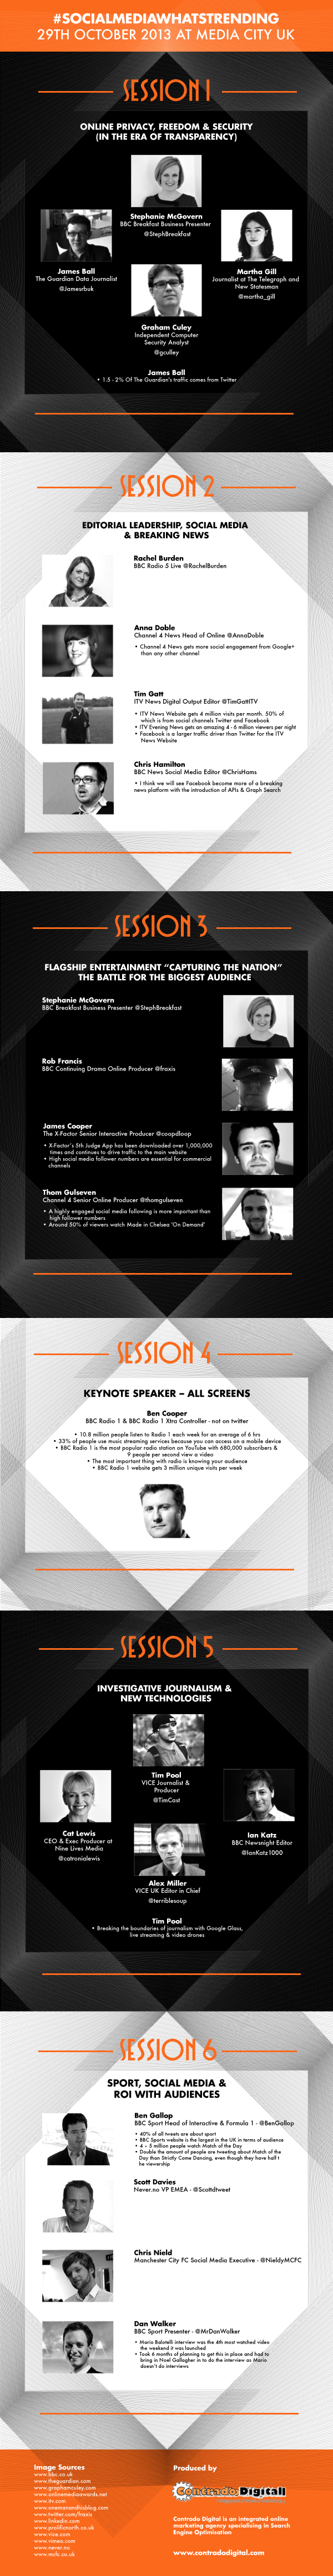
Overall the #SocialMediaWhatsTrending event was a fantastic day with lots of knowledgeable speakers. It was great to find out about the juicy bits of data from some of the most well-known websites and brands in the UK. If you ever want to reference and of this information quickly, we have put together this infographic on the subject which summarises the whole day into nice bite sized chunks;

Click for full infographic
Want to embed this infographic on your website? Simply copy and paste the code below.
Halloween Fun
Where would we be without a bit of Halloween fun? Here is the BBC’s attempt at pumpkin carving, which one do you like the best?

by Michael Cropper | Oct 31, 2013 | Events |
Where: Media City UK
When: 29th October 2013
The #SocialMediaWhatsTrending event held at Media City UK was designed to gather industry experts together and look at ways where social media is changing the way people connect with businesses. The BBC Academy College of Journalism and BBC North designed the conference to bring together practitioners in journalism and content making from the digital world.
I’m sure a lot more people would have liked to attend the event, so hopefully we can cover some of the main bits here. Throughout the day there were two lots of sessions running. I was in the main session throughout the day so if anyone attended the breakout sessions, then please leave your feedback on those in the comments section.
Session 1 – Online Privacy, Freedom & Security (in the Era of Transparency)
The first session was chaired by Stephanie McGovern, the BBC Breakfast Business Presenter, with the panellists including; James Ball, The Guardian Data Journalist, Graham Culey, an Independent Computer Security Analyst along with Martha Gill, Journalist at The Telegraph and New Statesman.
Overall the session was really insightful, especially to find that The Guardian only receives around 1.5 – 2% of their traffic from Twitter. James Ball made a good point about how journalists are in a difficult situation since on one hand it is extremely important to protect their sources, although with the increasing usage of new technology this can lead to you compromising your sources without even realising.
Session 2 – Editorial Leadership, Social Media & Breaking News
The second session was chaired by Rachel Burden, BBC Radio 5 Live, with the panellists including; Anna Doble the Head of Online at Channel 4 News, Tim Gatt the ITV News Digital Output Editor along with Chris Hamilton the BBC News Social Media Editor.
Throughout the session, Tim Gatt gave a fantastic insight into the performance of the ITV News website which gets over 4 million visitors per month, 50% of which is from Twitter and Facebook. In addition, he revealed that ITV Evening News gets between 4 – 6 million viewers per night.
After which, Aziz Rashid the Head of BBC North West pointed out that this is beaten by BBC Regional News every night. Not that it is a competition…
Anna Doble gave an interest insight into how the Channel 4 News Google+ followers are actually far more engaged with Channel 4 compared with other social channels. This is an interesting topic since it was also debated at another session as to which is more important, a high number of followers or a highly engaged but lower number of followers.
Chris Hamilton is quite excited about the future of Facebook, particularly with the introduction of the Facebook Insights API and Graph Search. If you aren’t sure what they are, in short, the Facebook Insights API allows developers to pull aggregated demographic information from Facebook which can be used to better understand your audiences. Likewise, Facebook’s Graph Search allows users to easily find people who are interested in different topics, as an example you could search for “Developers in Blackburn who like Star Wars”. Ok maybe that is a bad example, as I’m sure that would include most developers, but hopefully this highlights what this is. The point Chris was making is that this really does allow businesses to find trending information that is happening right now, which has previously been left to the realms of Twitter.
Session 3 – Flagship Entertainment “Capturing the nation” – The Battle for the Biggest Audience
The third session was chaired by Stephanie McGovern the BBC Breakfast Business Presenter with panellists including; Rob Francis the BBC Continuing Drama Online Producer, James Cooper the X-Factor Senior Interactive Producer and Thom Gulseven the Channel 4 Senior Online Producer.
This again was an insightful session with interesting findings about the X-Factor around website traffic. James mentioned that while the website traffic from traditional sources was decreasing, this was being replaced by increases in traffic to the website which is being fuelled by the X-Factor 5th Judge App which has been downloaded more than 1 million times.
When James was asked if the 5th Judge App was leading to less people picking up the phone to vote, he didn’t have the figures. Although he did say that they are introducing a pay-in-app option, which one can only infer that this is the case and X-Factor are aiming to increase revenue via the mobile app.
The topic of engagement VS follower numbers came up and while Thom Gulseven would prefer a much more engaged audience on social channels, James believes that the large number of followers is still vitally important especially from a commercial point of view. Ultimately advertisers want to know how many people are going to be seeing their branding messages.
Another interesting piece of data that Thom mentioned was that around 50% of viewers watch Made in Chelsea ‘On Demand’ which is a staggering amount. This really does just show how the behaviour is changing for how people consume content. This leads nicely onto the keynote speaker of the day, Ben Cooper who talked about the shift away from different devices towards providing content on ‘All Screens’ at times when people want to watch things.
Session 4 – Keynote Speaker – All Screens
The keynote speaker for the day was Ben Cooper the BBC Radio 1 & BBC Radio 1 Xtra Controller. Through his talk he really emphasised the importance of knowing your audience and what they want. This understanding is changing the way content is being created at the BBC and how it is then shared with the world.
One example Ben gave was how they have added an extra dimension to radio by adding 6 cameras per radio studio which is allowing them to create even more content with little extra effort involved. This extra dimensions is paving the way for engaging with different audiences who may not have listed live to a show previously. An example of this was the recent interview with Kanye West which has been viewed on YouTube over 1.5 million times within the space of 6 weeks since being uploaded.
One really interesting point mentioned is about how the BBC are looking to incorporate Radio 1 into the iPlayer platform instead of using YouTube. This is really interesting since this is starting to move the power of short form video away from the Google owned YouTube platform back to the BBC.
As part of the ‘All Screens’ topic, Ben mentioned that 33% of people use music streaming services simply because they can access them via a mobile device. Around this topic, there is always the debate if music streaming services are going to replace radio and Ben simply doesn’t believe this to be true. Radio has much more of a personality and allows listeners to connect with the presenter at a level that streaming services simply can’t offer. What I believe will be interesting in the future is how the two of these merge together. Are we going to start to see more homemade live streaming radio stations curated by amateur DJs which can build up a following of their own – all powered by a streaming service in the background? It is going to be interesting to see either way.
A few other interesting facts about Radio 1 is that the website gets approximately 3 million unique visits per week, the YouTube channel is the most popular radio station on YouTube with over 680,000 subscribers along with a fact that 9 people every second are watching a Radio 1 video on YouTube. On top of this, 10.8 million people listen to Radio 1 each week for an average of 6 hours. Ben mentioned that this is down from a previous average of 12 hours per week, but I would question if this is simply because audiences are simply consuming the content in different ways and the BBC hasn’t managed to integrate these new data sources to fully understand how people are consuming content.
Session 5 – Investigative Journalism & New Technologies
The next session started with Tim Pool, a VICE Journalist and Producer who is really breaking the boundaries of journalism by using new and exciting technologies. These technologies include live video streaming, Google Glass and drones with video camera attached.
An interesting point made by Tim is how he has had to use this technology in the past to get past the police who were blocking him from legally filming. The situation he described was how the police were lined up in a row blocking journalists’ access to an area so they couldn’t film. This is where the use of drones came in, Tim simply flew a drone over the police to start filming what he was legally allowed to.
Following on from Tim was a panel chaired by Cat Lewis the CEO and Executive Producer at Nine Lives Media with panellists including; Ian Katz the BBC Newsnight Editor and Alex Miller the VICE UK Editor in Chief. Throughout the discussion it was interesting to hear about the different rules that each company needs to follow along with how online criticism is dealt with.
On the BBC side, everything has to follow extremely strict guidelines whereas at VICE, things are a little more relaxed which allows them to put an interesting twist on their reporting. Due to the different approaches, the way criticism is dealt with also changes. If a slip is made by a BBC presenter then the usual ‘we are very sorry’ comes out, whereas if a similar thing were to happen with VICE, then this would be a more relaxed approach and often the readers would understand that actually, what was said wasn’t said in a negative light.
Session 6 – Sport, Social Media & ROI with Audiences
The final session of the day was chaired by Ben Gallop the BBC Sports Head of Interactive & Formula 1 with panellists including; Scott Davies the VP EMEA of Never.no, Chris Nield the Social Media Executive at Manchester City FC along with Dan Walker the BBC Sports Presenter.
This final session raised some interesting points about how to handle trolls online, with the panel having different methods of dealing with this. One can simply ignore the trolls and get on with your day, whereas others have found that retweeting hate messages to their followers allows their followers to deal with the problem on their behalf. There is no sure fire answer here to the problem trolls cause online, so I’m sure we are going to see a lot more debates about this topic in the future.
An interesting statistic from Ben Gallop was that 40% of all tweets are about sport. I’m not sure where that figure has come from and it isn’t one that I am sure is 100% correct. I have found a study that 40% of tweets are ‘babble’, which depending on how you read that could be sports or not.
Ben did go on to say that the BBC Sports website is the largest in the UK in terms of audience and that around 4 – 5 million people watch Match of the Day each week. On a social media point, it was interesting to find out that approximately twice as many people are tweeting about Match of the Day compared to Strictly Come Dancing, even though Strictly has double the audience. This again comes down to the point raised earlier about engagement.
Dan Walker gave an interesting insight into how they managed to interview Mario Balotelli. He notoriously doesn’t do interviews with people, although Dan found out that he was a huge fan of Noel Gallagher and that Noel also liked to dedicate a song to Mario at different gigs. It took 6 months to plan but eventually Dan managed to organise an interview of Mario with Noel. This just goes to show the importance of creating unique and engaging content and that it takes time and effort to do this.
Summary
Overall the #SocialMediaWhatsTrending event was a fantastic day with lots of knowledgeable speakers. It was great to find out about the juicy bits of data from some of the most well-known websites and brands in the UK. If you ever want to reference and of this information quickly, we have put together this infographic on the subject which summarises the whole day into nice bite sized chunks;
Click for full infographic
Want to embed this infographic on your website? Simply copy and paste the code below.
Halloween Fun
Where would we be without a bit of Halloween fun? Here is the BBC’s attempt at pumpkin carving, which one do you like the best?
by Michael Cropper | Oct 7, 2013 | Uncategorized @en-us |
As Google turned 15 last month, you may have heard about a change with their algorithm that was announced a couple of weeks ago called Hummingbird. What you may not be too familiar with is what this actually is and what this means for your business. Hopefully after reading this blog post you will be up to speed with this change and how it impacts things. After all, this change was the first time since 2001 where the whole algorithm was rewritten so dramatically.

Image courtesy of Search Engine Land
What is Hummingbird?
Hummingbird is the name that has been given to Google’s latest algorithm change which is all about being “precise and fast”. More importantly, Hummingbird is designed to understand the meaning behind the words people are searching for, especially with more complex queries. One example given included how they could understand where you live if you searched for “Pizza shops near my home”, if you have shared that location data with Google.
With Google looking at the meaning behind the words and whole phrases being searched for, this means that pages that contain information that specifically answers the users query are more likely to rank higher than pages that simply contain the words on the page. This is only a good thing and it once again highlights the need to focus on awesome content that answers user’s queries in the best way possible.
Google stated that a search for “Pizza Hut calories per slice” used to bring up a website that simply contained that information on. Now what they are aiming to achieve with the Hummingbird algorithm is to understand that the two words “Pizza Hut” actually relate to the brand, so that information would be used to find information on the Pizza Hut website about “calories per slice”. When I have just performed this search, the other websites still are outranking Pizza Hut which goes to show that the algorithm still has a long way to go to fully understand entities within a semantic search environment.
Another example of how Hummingbird is understanding entities better is when you search for “Blackpool Tower VS Eiffel Tower” and you are presented with a nice comparison of the two;

Previously this search query would likely have just presented a page that contains a bit of information about the two different topics which may or may not have had the answer a user was looking for.
Do you need to change anything?
With the new Hummingbird algorithm being out in the wild, the one question on everyone’s mind is whether they need to change anything they are doing. In summary, no. The best practice still remains true which is to build amazing, original, high quality, sharable and linkable content for your customers.
Hummingbird is all about how Google understands information that is already out there. So all of the important signals that we know Google is using are still as important with Hummingbird in place.
With Hummingbird being all about how Google understands content better, this once again should take the focus away from specific keywords and to a place that is all about users and providing them with the answers they need. Put yourself in your customer’s shoes and understand what types of things they are seeking answers for. Identify those needs and problems and help provide solutions and answers to them.
Should you worry about a Hummingbird penalty?
No. Hummingbird is simply changing the way Google understands your content. Based on this understanding they are able to provide better search results to users searching on Google for complex queries. With previous animal named algorithm updates, Panda and Penguin, it is rightfully so that people would ask this question. With this change being launched over a month ago unofficially, if you have noticed a change then it isn’t likely to do with the algorithm but it is more likely due to one of the other 200 signals that Google uses within their ranking algorithm.
Looking through various Google Analytics account and rank tracking data, we haven’t seen any changes related to the Hummingbird algorithm change.
What is the real reason behind the change?
More and more people are searching on Google from mobile devices and this search behaviour isn’t just standard text based. With the advent of voice search on Google (both from your mobile device and from normal desktop search) this is driving more complex queries which needed a change in thinking for how Google answers those queries.
Previously Google was all about the words on a page without any real understanding behind them. They understood that if a page mentioned “Britney” that it was also likely to mention “Spears” but they didn’t understand that “Britney Spears” was a person. Back in May, Google announced Knowledge Graph which is all about understanding entities and real world things in greater detail. Hummingbird is the logical next step to this.
Looking at a conversational search example, the aim is to allow users to simply talk to their device in a conversational way and to get back useful information throughout this process without being explicit each time.
Being able to understand potentially lengthy conversations means that Google needs to really understand the meaning of the words behind the query to be able to serve the best possible information to the user. It is going to be interesting to see how this develops over time and how user’s behaviour starts to change with new technology such as this.
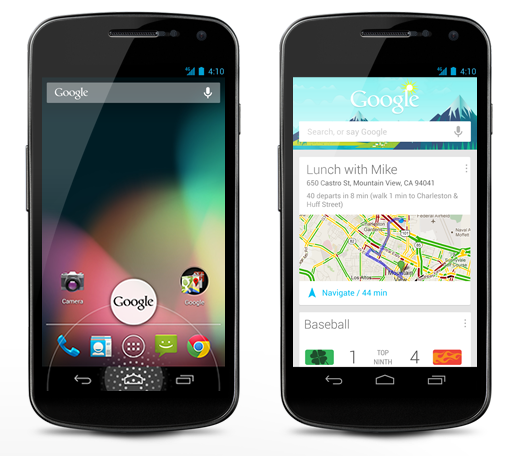
Google Voice Search
Additional video
Since posting this blog post I have re-stumbled upon an old video from a few months ago where Matt Cutts (Head of Web Spam at Google) talks about the change in behaviour they are seeing with people searching on mobile phones. Specifically to a more conversational style search;
Future opportunities
With Hummingbird being all about how Google understands content, the biggest tip that we can give at the minute is to start taking Schema.org markup seriously. If you don’t already know, Schema.org markup is simply a way to markup your content into some kind of structured way that search engines can understand more easily.
Google already supports several Schema.org tags and this list is only going to grow over time. Some Schema.org tags already give you direct benefit within the search results, such as review rich snippets standing out, although there are others that haven’t been announced yet. Implementing these now won’t gain you any extra benefit in the short term, although it will certainly put you in the right position for when Google does look at these additional tags.
As can be seen from a lot of the major changes recently (knowledge graph, conversational search, Hummingbird) it is clear that Google is always looking to understand the world we live in more.
by Michael Cropper | Oct 7, 2013 | News, SEO |
As Google turned 15 last month, you may have heard about a change with their algorithm that was announced a couple of weeks ago called Hummingbird. What you may not be too familiar with is what this actually is and what this means for your business. Hopefully after reading this blog post you will be up to speed with this change and how it impacts things. After all, this change was the first time since 2001 where the whole algorithm was rewritten so dramatically.
Image courtesy of Search Engine Land
What is Hummingbird?
Hummingbird is the name that has been given to Google’s latest algorithm change which is all about being “precise and fast”. More importantly, Hummingbird is designed to understand the meaning behind the words people are searching for, especially with more complex queries. One example given included how they could understand where you live if you searched for “Pizza shops near my home”, if you have shared that location data with Google.
With Google looking at the meaning behind the words and whole phrases being searched for, this means that pages that contain information that specifically answers the users query are more likely to rank higher than pages that simply contain the words on the page. This is only a good thing and it once again highlights the need to focus on awesome content that answers user’s queries in the best way possible.
Google stated that a search for “Pizza Hut calories per slice” used to bring up a website that simply contained that information on. Now what they are aiming to achieve with the Hummingbird algorithm is to understand that the two words “Pizza Hut” actually relate to the brand, so that information would be used to find information on the Pizza Hut website about “calories per slice”. When I have just performed this search, the other websites still are outranking Pizza Hut which goes to show that the algorithm still has a long way to go to fully understand entities within a semantic search environment.
Another example of how Hummingbird is understanding entities better is when you search for “Blackpool Tower VS Eiffel Tower” and you are presented with a nice comparison of the two;
Previously this search query would likely have just presented a page that contains a bit of information about the two different topics which may or may not have had the answer a user was looking for.
Do you need to change anything?
With the new Hummingbird algorithm being out in the wild, the one question on everyone’s mind is whether they need to change anything they are doing. In summary, no. The best practice still remains true which is to build amazing, original, high quality, sharable and linkable content for your customers.
Hummingbird is all about how Google understands information that is already out there. So all of the important signals that we know Google is using are still as important with Hummingbird in place.
With Hummingbird being all about how Google understands content better, this once again should take the focus away from specific keywords and to a place that is all about users and providing them with the answers they need. Put yourself in your customer’s shoes and understand what types of things they are seeking answers for. Identify those needs and problems and help provide solutions and answers to them.
Should you worry about a Hummingbird penalty?
No. Hummingbird is simply changing the way Google understands your content. Based on this understanding they are able to provide better search results to users searching on Google for complex queries. With previous animal named algorithm updates, Panda and Penguin, it is rightfully so that people would ask this question. With this change being launched over a month ago unofficially, if you have noticed a change then it isn’t likely to do with the algorithm but it is more likely due to one of the other 200 signals that Google uses within their ranking algorithm.
Looking through various Google Analytics account and rank tracking data, we haven’t seen any changes related to the Hummingbird algorithm change.
What is the real reason behind the change?
More and more people are searching on Google from mobile devices and this search behaviour isn’t just standard text based. With the advent of voice search on Google (both from your mobile device and from normal desktop search) this is driving more complex queries which needed a change in thinking for how Google answers those queries.
Previously Google was all about the words on a page without any real understanding behind them. They understood that if a page mentioned “Britney” that it was also likely to mention “Spears” but they didn’t understand that “Britney Spears” was a person. Back in May, Google announced Knowledge Graph which is all about understanding entities and real world things in greater detail. Hummingbird is the logical next step to this.
Looking at a conversational search example, the aim is to allow users to simply talk to their device in a conversational way and to get back useful information throughout this process without being explicit each time.
Being able to understand potentially lengthy conversations means that Google needs to really understand the meaning of the words behind the query to be able to serve the best possible information to the user. It is going to be interesting to see how this develops over time and how user’s behaviour starts to change with new technology such as this.
Google Voice Search
Additional video
Since posting this blog post I have re-stumbled upon an old video from a few months ago where Matt Cutts (Head of Web Spam at Google) talks about the change in behaviour they are seeing with people searching on mobile phones. Specifically to a more conversational style search;
Future opportunities
With Hummingbird being all about how Google understands content, the biggest tip that we can give at the minute is to start taking Schema.org markup seriously. If you don’t already know, Schema.org markup is simply a way to markup your content into some kind of structured way that search engines can understand more easily.
Google already supports several Schema.org tags and this list is only going to grow over time. Some Schema.org tags already give you direct benefit within the search results, such as review rich snippets standing out, although there are others that haven’t been announced yet. Implementing these now won’t gain you any extra benefit in the short term, although it will certainly put you in the right position for when Google does look at these additional tags.
As can be seen from a lot of the major changes recently (knowledge graph, conversational search, Hummingbird) it is clear that Google is always looking to understand the world we live in more.