by Michael Cropper | Feb 13, 2016 | Developer |
To set the scene. Firstly, you should never be hosting emails on your web server, it is extremely bad practice these days for a variety of reasons, read the following for why; Really Simple Guide to Business Email Addresses, Really Simple Guide to Web Servers, Really Simply Guide to Web Server Security, The Importance of Decoupling Your Digital Services and most importantly, just use Microsoft Exchange for your email system.
Ok, so now we’ve got that out of the way, let’s look at some of the other practicalities of web application development. Most, if not all, web applications require you to send emails in some form to a user. Whether this is a subscriber, a member, an administrator or someone else. Which is why it is important to make sure these emails are being received in the best possible way by those people and not getting missed in the junk folder, or worse, automatically deleted which some email systems actually do.
Sending emails from your web application is not always the most straight forward task and hugely depends on your web server configuration, the underlying technology and more. So we aren’t going to cover how to do this within this blog post, instead we are going to assume that you have managed to implement this and are now stuck wondering why your emails are ending up in your and your customers junk folders. The answer to this is often simple, it’s because your email looks like spam, even though it isn’t.
Introducing Sender Policy Framework (SPF Records)
The Sender Policy Framework is an open standard which specifies a technical method to prevent sender address forgery. To put this into perspective, it is unbelievable simple to send a spoof email from your.name@your-website.com. Sending spoof emails was something I was playing around with my friends when still in high school at aged 14, sending spoof emails to each other for a bit of fun and a joke.
Because it is so simple to send spoof emails, most email providers (Microsoft Exchange, Hotmail, Outlook, Gmail, Yahoo etc.) will often automatically classify emails as spam if they aren’t identified as a legitimate email. A legitimate email in this sense is an email that has been sent from a web server which is handling the Mail Exchanger technologies.
To step back a little. The Mail Exchanger, is a record which is set at the DNS level which is referred to as the MX record. What this record does is that whenever someone sends an email to your.name@your-website.com, the underlying technologies of the internet route this email to the server which is handling your emails, the server which is identified within your MX Record at your DNS. The server then does what it needs to do when receiving this email so you can view it.
For example, when hosting your email on your web server with IMAP (as explained before, you shouldn’t be doing this), your MX record will likely be set to something along the lines of ‘mail.your-domain.com’. When using Microsoft Exchange, your MX record will be something along the lines of ‘your-domain-com.mail.protection.outlook.com’.
What this means is that if an email is sent from @your-domain.com which hasn’t come from one of the IP addresses attached to your-domain-com.mail.protection.outlook.com, then this looks to have been sent by someone who is not authorised to send emails from your domain name, and hence why this email will then end up in the spam box.
With Microsoft Exchange specifically to use this as an example, you will also have an additional SPF record attached to your DNS as a TXT type which will look something along the lines of, ‘v=spf1 include:spf.protection.outlook.com -all’, which translates as, the IP addresses associated with the domain spf.protection.outlook.com are allowed to send emails from the @your-domain.com email address, and deny everything else.
This is perfect for standard use, but doesn’t work so well when trying to send emails from a web application. Which is why we need to configure the DNS records to make the web server which is sending emails from your web application a valid sender too.
How to Configure your DNS with SPF Records
To do this, we simply add the IP address of your web server into the DNS TXT SPF record as follows;
v=spf1 include:spf.protection.outlook.com ip4:123.456.123.456 –all’
Your records will likely be different, so please don’t just copy and paste the above into your DNS. Make sure you adapt this to your individual needs. That is it. Now when your web application sends emails to your users, they will arrive in their main inbox instead of their junk folder. Simple.
A few handy tools for diagnosing DNS propagation along with SPF testing include;
by Michael Cropper | Feb 7, 2016 | Developer |
Quick reference guide for how to implement. Let’s Encrypt is a new free certificate authority, allowing anyone and everyone to encrypt communications between users and the web server with ease. For many businesses, cost is always a concern, so saving several hundred pounds for a basic SSL Certificate often means that most websites aren’t encrypted. This no longer needs to be the case and it would be recommended to implement SSL certificates on every website. Yes…we’re working on getting around to it on ours 🙂
We recently implemented Let’s Encrypt on a new project, Tendo Jobs and I was quite surprised how relatively straight forward this was to do. It wasn’t a completely painless experience, but it was reasonably straight forward. For someone who manages a good number of websites, the cost savings annually by implementing Let’s Encrypt on all websites that we manage and are involved with is enormous. Looking forward to getting this implemented on more websites.
Disclaimer as always, make sure you know what you’re doing before jumping in and just following these guidelines below. Every web server setup and configuration is completely different. So what is outlined below may or may not work for you, but hopefully either way this will give you a guide to be able to adjust accordingly for your own web server.
How to Set up Lets Encrypt
So, let’s get straight into this.
- Reference: https://community.letsencrypt.org/t/quick-start-guide/1631
- Run command, yum install epel-release, to install the EPEL Package, http://fedoraproject.org/wiki/EPEL. Extra Packages for Enterprise Linux, lots of extra goodies, some of which are required.
- Run command, sudo yum install git-all, to install GIT, https://git-scm.com/book/en/v2/Getting-Started-Installing-Git
- Clone the GIT repository for Let’s Encrypt with the command, git clone https://github.com/letsencrypt/letsencrypt, http://letsencrypt.readthedocs.org/en/latest/using.html#id22
- For cPanel servers, need to run a separate script, hence the next few steps
- Install Mercurial with the command, yum install mercurial, http://webplay.pro/linux/how-to-install-mercurial-on-centos.html. This is Mercurial, https://www.mercurial-scm.org/
- Run the install script command, hg clone https://bitbucket.org/webstandardcss/lets-encrypt-for-cpanel-centos-6.x /usr/local/sbin/letsencrypt && ln -s /usr/local/sbin/letsencrypt/letsencrypt-cpanel* /usr/local/sbin/ && /usr/local/sbin/letsencrypt/letsencrypt-cpanel-install.sh, https://bitbucket.org/webstandardcss/lets-encrypt-for-cpanel-centos-6.x
- Run the command to verify the details have been installed correctly, ls -ald /usr/local/sbin/letsencrypt* /root/{installssl.pl,letsencrypt} /etc/letsencrypt/live/bundle.txt /usr/local/sbin/userdomains && head -n12 /etc/letsencrypt/live/bundle.txt /root/installssl.pl /usr/local/sbin/userdomains && echo “You can check these files and directory listings to ensure that Let’s Encrypt is successfully installed.”
- Generate an SSL certificate with the commands;
- cd /root/letsencrypt
- ./letsencrypt-auto –text –agree-tos –michael.cropper@contradodigital.com certonly –renew-by-default –webroot –webroot-path /home/{YOUR ACCOUNT HERE}/public_html/ -d tendojobs.com -d www.tendojobs.com
- Note: Make sure you change the domains in the above, your email address and the {YOUR ACCOUNT HERE} would be replaced with /yourusername/ without the brackets.
- Reference: https://forums.cpanel.net/threads/how-to-installing-ssl-from-lets-encrypt.513621/
- Run the script with the commands;
- cd /root/
- chmod +x installssl.pl
- ./installssl.pl tendojobs.com
- Again, change your domain name above
- Set up a CRON Job within cPanel as follows, which runs every 2 months;
- 0 0 */60 * * /root/.local/share/letsencrypt/bin/letsencrypt –text certonly –renew-by-default –webroot –webroot-path /home/{YOUR ACCOUNT HERE}/public_html/ -d tendojobs.com -d www.tendojobs.com; /root/installssl.pl tendojobs.com
- For reference, The SSL certificate is placed in /etc/letsencrypt/live/bundle.txt when installing Let’s Encrypt.
- Done!
Note on adding CRON job to cPanel, this is within cPanel WHM, not a cPanel user account. cPanel user accounts don’t have root privileges so a CRON job from within here won’t work. To edit the CRON job at the root level, first SSH into your server, then run the following command to edit the main CRON job file;
crontab -e
Add the CRON job details to this file at the bottom. Save the file. Then restart the CRON deamon with the following command;
service crond restart
It is recommended to have a 2 month renewal time at first as this gives you 4 weeks to sort this out before your certificate expires. Thankfully you should receive an email from your CRON service if this happens and you will also receive an email from Let’s Encrypt when the certificate is about to expire so there are double safe guards in place to do this.
On-Going Automatic Renewal & Manually SSL Certificate Installation
Important to note that when you automatically renew your Let’s Encrypt certificates, they won’t be automatically installed. The installssl.pl script doesn’t seem to handle the installation of the certificate. Instead, you may need to update the renewed certificates within the user cPanel account for the domain manually. To do this, open cPanel and view the SSL/TSL settings page, update the currently installed (and about to expire) SSL certificate and enter in the new details. The details for the new certificate will need to be obtained via logging into the ROOT server via SSH and viewing the updated SSL certificate details in the folder, /etc/letsencrypt/live/yourdomain.com where you can use the command pico cert.pem and pico privkey.pem to view the details you need to copy over to cPanel. It’s decoding the SSL certificates in these two files to make sure the dates have been updated, you can use a tool such as an SSL Certificate Decoder to decode the certificate. If the certificate is still showing the old details, then you may need to run the command letsencrypt-auto renew which will update the certificates.
Hope this is useful for your setup. Any questions, leave a comment.
by Michael Cropper | Nov 15, 2015 | Developer, Technical |
Naturally working on a lot of web application projects in multiple languages from Java EE to PHP to websites to mobile applications, one common thing that we see time and time again is the lack of thought that goes into design patterns for websites and web applications. Often having to pick up projects at this point, generally when they have already gone seriously wrong, we can’t but help think that there must be a better way to prevent these issues we see through sharing best practices to ensure scalable web applications are built and can be maintained with ease. Specifically for this blog post we are going to look at the Model View Controller MVC design pattern.
If you are working in any form of software development, website development or web application development, I’d argue that this is one of the most powerful design patterns to get your head around as when you fully understand the relatively simple approach behind the MVC design pattern this allows you to think about the structure of your code and project before jumping in and writing a single line of code. By taking this time up front, I can absolutely guarantee that this will save you an unbelievable amount of time working on your application over time and most importantly, for the businesses you are working with this will help to ensure bugs, features, functionality improvements and tweaks can be delivered much faster with fewer errors.
What is the Model View Controller MVC Design Pattern
So let’s just take things back a step as if you haven’t been working away on larger web application projects previously, you may not even be aware of the MVC design pattern, hopefully you are away of what design patterns actually are if you are working in web application development though, if not, then I recommend going on a date with Amazon to learn about design patterns.
The MVC design pattern is a way of structuring your code to break up the key elements of your web application which includes;
- Model: These are the bits of code that actually do things
- View: These are the bits of code that make the things look pretty
- Controller: These are the bits of code that control what happens when someone requests a resource such as a page on your website, the business logic of your web application
Ok, so it’s a little more complex than that in the background, but that is MVC explained in the simplest way. I’m not going to talk about the theory of MVC to the n’th degree, instead I’m going to look at the practicalities of MVC while dabbling into the Single Responsibility Principle design pattern and how the two link together extremely well.
For the purposes of this blog post, we are going to focus on Java as the programming language to highlight this concept as Java is better than PHP. Fact (in my opinion). 😉 (cue the haters…). On a serious note though the reason why we’re looking at Java for this example is because it is more suited to using a structured MVC design pattern for projects than PHP is, on the whole, which is due to the separation of the Model (Java classes), the View (JSPs) and the Controller (Java Servlets) which link in nicely together. For the same MVC setup in PHP you will probably be looking at something like the Zend Framework which has been designed to focus around an MVC architecture. With that understanding, let’s look at the practicalities of MVC and why this is such an awesome design pattern that you really need to be using.
Benefits of the MVC Design Pattern
Before we jump into a few simple examples of using the Model View Controller MVC design pattern, lets first just look at why this is such an awesome design pattern and why you should seriously consider using this for a variety of the web application projects you are working on.
Separation of Concerns
Being able to separate the key parts of your web application into the Model, the View and the Controller is an extremely efficient way of working. Being able to separate out the key functionality within your application from the business logic from your application and separating the visual and layout side of your application means that you can clearly focus on the task at hand and work effectively throughout your code.
Focused Developers and Niche Sill Sets
By breaking out your web application into key aspects this allows individual developers within the team to be highly specialised and focus on the areas that they are good in without worrying about other skill sets that are likely outside of their expertise. For example, front end developers who are extremely proficient in HTML, Javascript and CSS are likely to be a little confused by back end technologies such as Java Servlets, database connectivity and APIs. Likewise, developers focusing on the business logic of an application are likely more well suited to this opposed to writing the key functionality and connecting with external APIs and more.
This also allows updates to various points within your web application without impacting the other aspects. For example, you can quite simply make changes to your user interface without impacting the business logic within your application. This is an extremely powerful setup to allow your web application to be modified with ease.
Parallel Development across Multiple Teams
As your web applications grows, multiple teams of developers will be working on your application code base to enhance features and functionality. By using a true MVC design pattern, this allows multiple people to work on your code base with ease.
As your web application grows using a non-MVC design pattern, you will soon reach the point whereby developers are struggling to work on a project without impacting the work of another developer, to the point whereby this may actually restrict the amount of work that can be completed during any given time scale. This is not a good position to be in and if you reach this point, you will soon see how much more efficient the MVC design pattern really is.
MVC in Practice
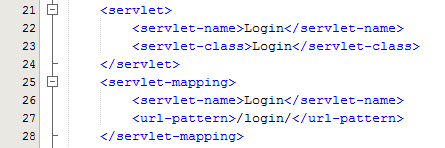
Within Java, you have your deployment descriptor which is designed to control how requests are handled when a user types in a URL on your website. For example, when someone visits www.example.com/login/ the web.xml file will send the request on to the Controller file named Login.java in this example;
The Controller – Login.java
Taking this example, the Controller is just a standard Java Servlet which is designed to handle the incoming request and control whatever you want to do with these requests. For example, and keeping things basic, on a login page a user may have been redirected to this page after trying to access a restricted resource and it would be nice to redirect the user back to the page they were trying to access instead of to a generic login landing page;
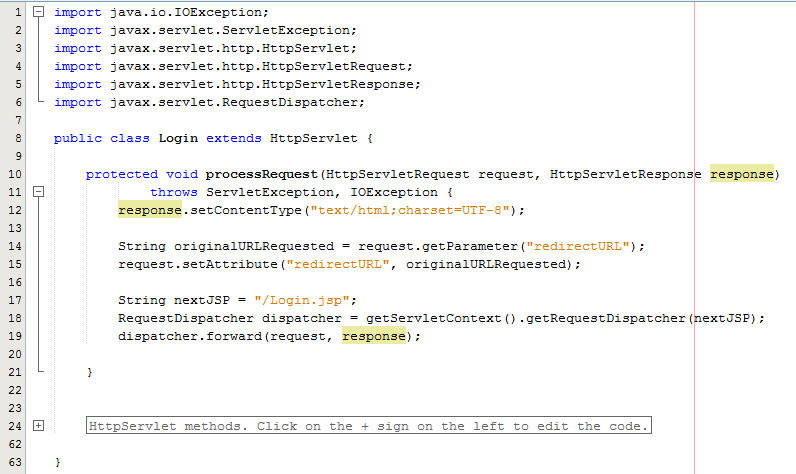
The concept of the Controller is designed to take care of the business logic part of the web application so you can build in the logic you require whilst keeping the key functionality separate. This is hugely important as this means that as the development team grows one team can be working on the business logic while another team can be working on the key functionality without impacting the workflow of either team. The above example is purely the Controller which then forwards the request onto the JSP to provide the View aspect of the process, but we have missed one key aspect, the Model. In the example above there are no calls to and Model classes designed to pull in key data, so let’s look at an example where the Model is used before we look at the View part of the process.
The Model
So let’s imagine that whenever somebody accesses the login page, an email is sent to someone. You would never do this in practice as this is just pointless, but this highlights the concept of the Model. In the same context and looking at something more practical, you would use the Model to retrieve some data from the database such as a snippet of text for example which is controlled by a content management system type setup. Never the less, we’ll use this as an example.
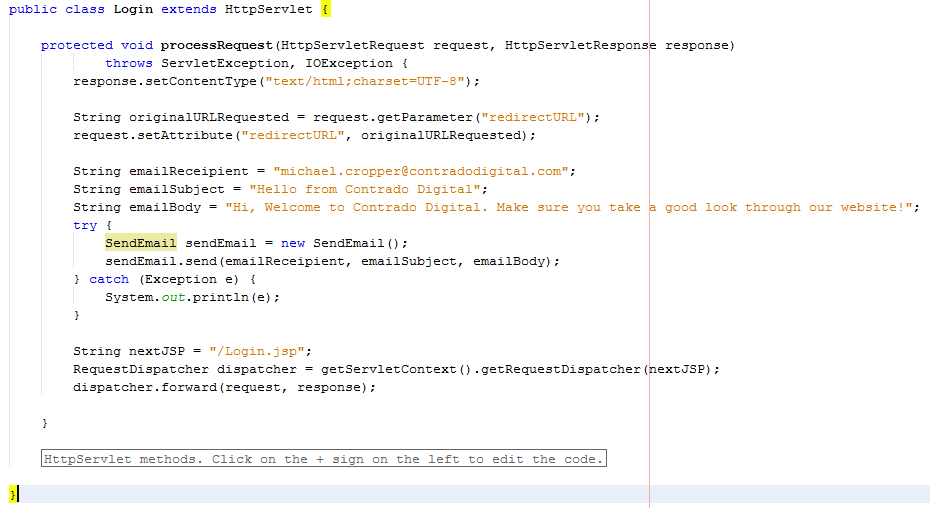
The functionality to send an email has been broken out into its own class designed to break out the business logic which is “When someone views the login page, send an email” from the actual functionality for sending an email.
The Model – SendEmail.java
Looking specifically at the Model class, this is designed to actually implement the core functionality that you require. In this example send an email. From here, you can control specific functionality and separate this functionality completely away from the business logic of the application. Here helps you to work more efficiently by building up a solid and scalable library of core functionality that drives your web application rather than just simply working with a system which contains highly coupled code.
Taking this example beyond the simple SendEmail() functionality which is purely focused on completing a specific action in the background, another more specific example would be to collect data from the database which is then sent on to the View which is for the user to see who has requested the original resource. For example, taking the MVC web application to the perfect situation whereby every single aspect of content is purely database driven, the result would be a Model class along the lines of getMetaTitle(url) which is designed for the Controller to generate the correct meta data for the page that has been requested.
The Model classes are where the real power lies within your web application. Here lies the true power of how your web application implements the cool features and functionality throughout the entire system. The Controller allows you to do exactly that, control how the Models are pieced together when a specific URL is requested which allows you to create the fantastic experience for your website visitors.
The View – Login.jsp
So let’s look at a more practical example whereby you have used a Model class to retrieve some data from the database for what the HTML H1 should be. Once you have received this data in the Controller Servlet you need to then add this data to the Request object so that this can then be retrieved by the View JSP;
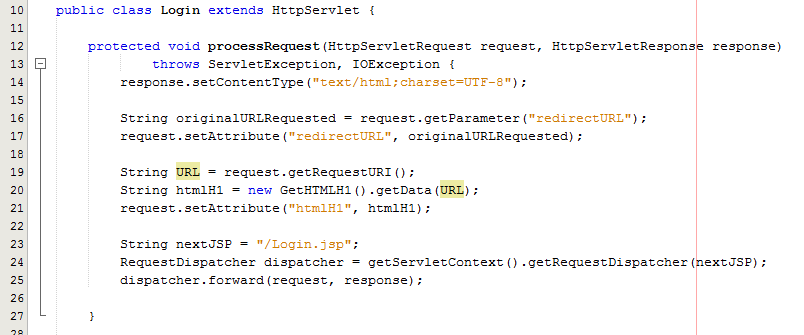
As can be seen in the code above from the Controller Servlet, setting the attribute for the data that you wish to pass to the View is the next step in the process. From here, now let’s look at the View part of the MVC design pattern to look at how to retrieve this data in a safe way.
Here we can take a look at the View, login.jsp, which is designed to handle the visual side of the web application. From here you have the ability to retrieve data passed to the View from the Controller and there are several ways of doing this.
At the most basic level, you can use a small scriptlet such as;
<%= request.getAttribute(“htmlH1”) %>
Which is will output the data contained within the stored attribute named “htmlH1”. So if you wanted to wrap this in a H1 tag then this would look as follows within the JSP;
<h1><%= request.getAttribute(“htmlH1”) %></h1>
Simple and effective. The problem here though is that as your web application scales, particularly on an international level, this isn’t the best approach to take as there can be a variety of differences for different locales such as time and date formatting along with currency formatting etc. So lets look at how best to handle requesting data from the Request object and displaying this within the View JSP through the use of the Java Standard Tag Library, JSTL.
JSTL has been designed to be a more user friendly way of displaying content within the JSP without the need for using scriptlets which should never really be used if possible. With JSTL the tags used will look very similar to any web developer who has been using HTML for a while. They follow the same logic with tags and attributes, the difference being is that JSTL is designed to apply common activities to JSPs such as simple items including displaying some content such as the HTML H1 tag content or something more advanced such as a For or While loop. Below follows on form the basic example given already, with the use of displaying the HTML H1 tag on the page;
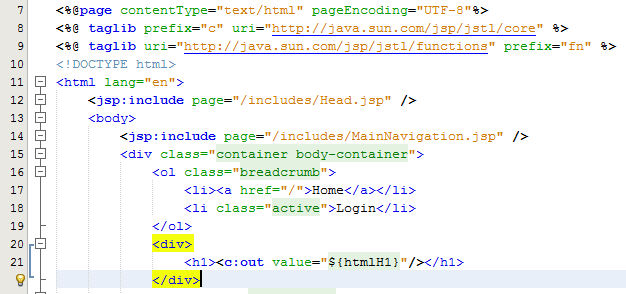
Here there are a few things to point out to understand what is happening. Firstly, there are two lines at the top which allow you to use the full power of JSTL which are;
<%@ taglib prefix=”c” uri=”http://java.sun.com/jsp/jstl/core” %>
<%@ taglib uri=”http://java.sun.com/jsp/jstl/functions” prefix=”fn” %>
The first line is for using the Core JSTL functionality, while the second line is to use the JSTL functions for things such as data manipulation. In this example, we’re only going to need the core functionality. So is you notice the section for displaying the HTML H1 tag is as follows;
<h1><c:out value=”${htmlH1}”/></h1>
The <c: prefix in the code above is telling the JSP to use the JSTL Core functionality which was referenced previously in the page. Next this is telling JSTL to display the contents contained within the attribute named “htmlH1” which we set previously in the Controller Servlet. So that when you look at this on the original Login page you just requested then you see this information as you would expect;
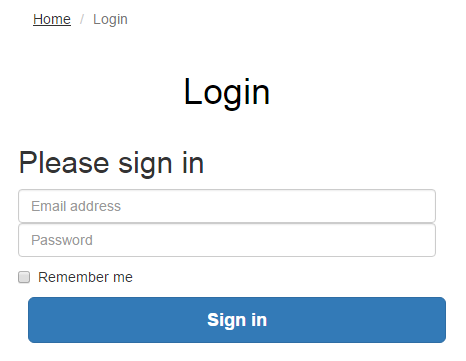
Sounds simple, right? Well, yes, it actually is extremely simple to use a Model View Controller MVC design pattern when you think through the structure of your code instead of just jumping in and writing code. The difference being is that when you stop to think about the design pattern that you are using within your web application that you can quite easily make huge improvements both now and in the future. The Model View Controller MVC design patter is just one of many extremely powerful design patterns that you should seriously consider using to make your code easier to create, scale and maintain in the future.
Summary of the Model View Controller MVC Design Pattern
Hopefully this covers the Model View Controller MVC design pattern in enough detail to understand why this is such a powerful design pattern to use when developing your web applications and also looks at the practicalities of implementing such a design pattern. Sure, you will certainly be writing more lines of code to implement such a design pattern although I can guarantee that you will be creating a much more efficient system overall and a system that is easier to scale and maintain in the future.
The key to implementing a great MVC design pattern throughout your web application comes down to planning. You need to be planning this design pattern extremely well and to make sure that your entire development team is working towards the same goals. It is important to discuss these things on a regular basis as this will ensure that everyone is developing code with this design pattern in mind.
by Michael Cropper | Oct 24, 2015 | Developer |
WordPress is great, right. It can do wonderful things, makes life easy for so many businesses and is our preferred choice for many business websites. This being said, because WordPress has been designed to work across almost every server configuration you can imagine, there are a lot of hacks in place which aren’t the most efficient way of doing things. WP_Cron() is one of these tasks. That’s why we have taken a look at this in a bit more details to see how we can improve the performance of our server by optimising core WordPress code across all websites we host. Before we jump into the finer details, let’s just look at what a Cron Job is, what is the WordPress Cron Job equivalent and how it works. Then we can look at how to improve server performance based on this understanding and hard data.
What is a Cron Job
A Cron Job is best understood to be a command that is executed at a certain point of time on a regular basis. For example, execute command on Every Friday at 5pm, or Every Month on the 3rd Day of the Month. A Cron Job is designed to automate functionality meaning that you don’t have to manually trigger something to happen. Cron Jobs are run from your Linux web server and have no relation to WordPress unless the command that is being run is designed to point at a WordPress file. For the purposes of this blog post, that basic understanding will suffice.
What is the WP_Cron
As mentioned previously, WordPress is designed to be able to run regardless of the finer details of the server settings in the background. What this means is that WordPress cannot and does not rely on the Linux Cron Job on the server to automate tasks as there is no guarantee that this will be available. Instead, WordPress has it’s very own version of a Cron Job which is a function confusingly named WP_Cron(). This has no relation to an actual Cron Job and is actually extremely inefficient in comparison. This function sits within the wp-cron.php file.
As Cron Job type functionality, such as that contained within the WP_Cron() function, can take a while to run this is actually run as a separate process in the background meaning that the user does not have to wait until the WP_Cron() finishes doing its jobs before loading the page for the user. This sounds great in theory, although when you realise that a single visit to your homepage is actually starting an additional process running in the background which is eating up precious server resources this nice functionality soon starts to get a bit annoying. In simple terms, think of this setup as the equivalent of how you would feel if every time you got into your car to drive to work that you also then had to drive a further 100 miles and back just because that was what was required. Seems pointless and a little over the top, right? Well, it is.
How does the WP_Cron work
So just how does the WP_Cron() actually work then. Well it has to be run in a fool proof way and the only way to do this is to be extremely verbose and err on the side of over enthusiasm rather than risk the WP_Cron() not actually running at all. As such, the WP_Cron() function is called whenever someone visits your website.
For small websites that get a low amount of traffic, this means that when someone visits the website, the WP_Cron() is run in a separate process in the background to check through if anything else needs to be done. These checks include things like turning scheduled blog posts into live blog posts, checking for theme updates, checking for plugin updates, multiple calls to third party websites along with any additional jobs that plugins have added to the list of things to do when WP_Cron() is called through the use of hooks, actions and filters. For small websites with not a great deal of traffic, this isn’t actually too bad although can result in a situation whereby the scheduled blog post you wanted to go live didn’t actually go live when you wanted it to because no-one visited your website.
For larger websites that get a lot of traffic and multiple concurrent users, this is a problem. Larger websites which are receiving 1 visitor per minute or even multiple visits per second, this process just gets silly. With endless checks for the same information again and again and again and again all straight after each other is just pointless and unnecessarily wastes server resources causing other problems. It’s the equivalent in the work place for when writing a report and after every sentence going to check your emails, complete all of the actions within those emails and then you can get back to writing your report. You’d be wasting so much time going through this process that you would probably never get the report completed.
So now we understand how the WP_Cron() function works, why and when it is called we can look at a more efficient method of running automated tasks. And this solution is to actually turn off the WP_Cron() functionality from running every time a user visits your website.
Disabling the WordPress Cron Job
This is actually extremely simple. While there are many plugins available to do the job, we would always recommend adding the following command to your wp-config.php file as this is the most efficient way to do this;
/* Disable WP Cron Running for Every Website Visit */
define(‘DISABLE_WP_CRON’, true);
In addition to this, we’d also recommend implementing the WP-Cron Control plugin which is designed to only allow the wp-cron.php file to actually run if there is a unique query string appended to the end. This is hugely important, since denial of service related attacks often target resource hungry processes and files such as the WordPress Cron file. When utilising this plugin in addition to the above, you will have the settings required for the next step below.
This will disable the WordPress Cron from running every time your website gets a new visitor. Now this is done, you need a way to actually run the WordPress Cron Job as you need this functionality to work for a variety of features on your website. As such, you’ll need to set up a Cron Job on your server. It you’re on Linux with cPanel, this is extremely simple to do with a command which is going to be specific to your individual server settings. That being said, not all web hosts are equal and some web hosts will actually have disabled this feature, so you’ll have to speak with your web hosting company for specific details about your own website.
Ok, so assuming that you’ve set up a separate Cron Job on your server now, great. You have now optimised the workflow of your WordPress website without breaking core functionality.
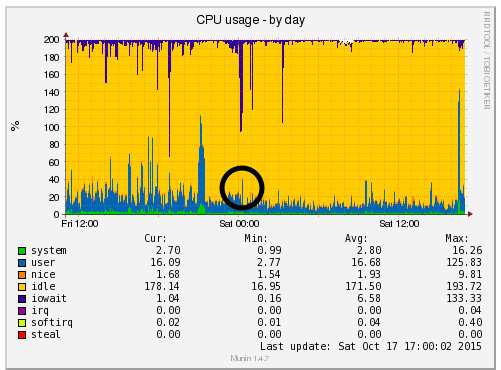
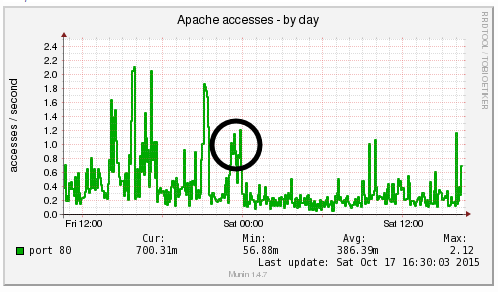
Results We Saw
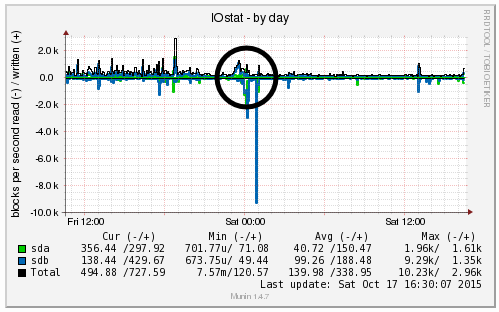
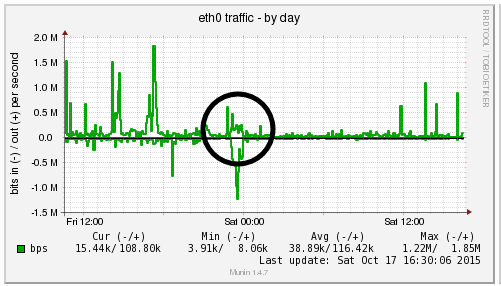
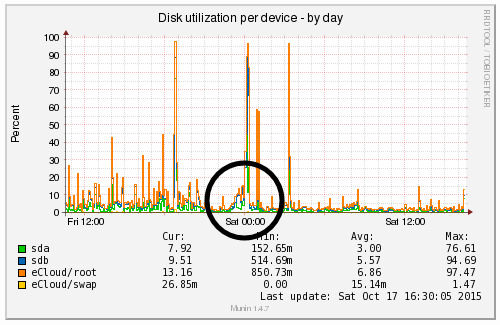
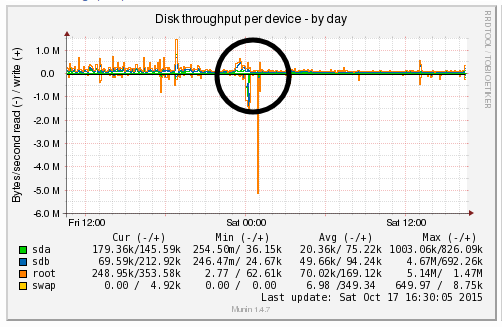
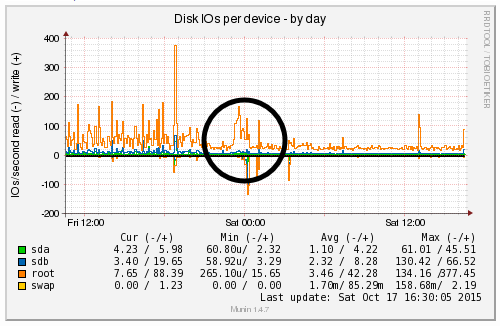
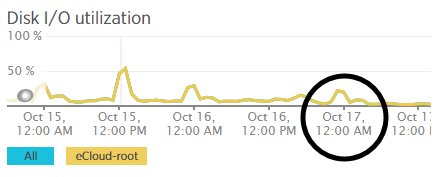
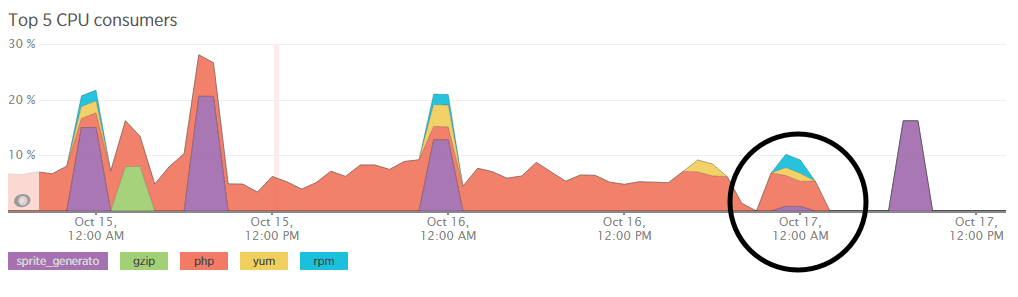
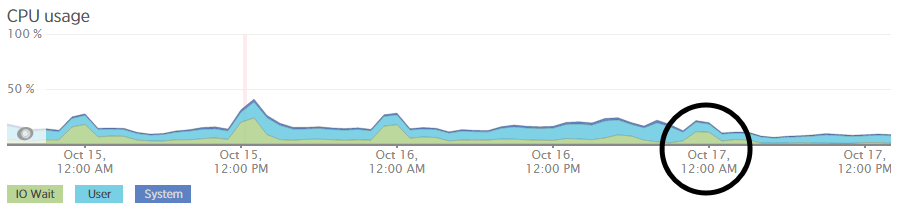
We’re a big believer in tracking performance improvements for everything we do which is why we use a range of reporting technologies to enable us to do this. We disabled the WordPress Cron functionality around 12am on October 17th, midnight, on the majority of websites on one of our servers. The data is clear. I/O wait virtually went down to zero, which can be seen in multiple graphs. User CPU usages significantly decreased. All in all, CPU usage down from around 19% to around 9%. Seriously awesome results. The variety of graphs below are from two of the key tools we use, New Relic and Munin. The performance improvements are as a direct result of the number of processes running in the background being significantly reduced as the WordPress Cron isn’t being called every time someone accesses the website. Instead, this is now being controlled at the server level which allows us to schedule these tasks in at times when server load is unlikely to be high, such as in the middle of the night.
by Michael Cropper | Oct 24, 2015 | Developer |
Technical post for those who are looking for this information. If you’ve come across this blog post, then you probably know what this is and are just looking for a quick solution to the problem, so below is what worked for us. We needed PHP mbstring installing on the server, specifically related to a WPML (WordPress MultiLingual) setup we had in place which required this setting to work. So we needed to rebuild the default Apache & PHP settings accordingly. For reference and in case this relates to anyone else, this is the error message we were receiving which required this specific update;
Warning: filter_input(): charset `ANSI_X3.4-1968′ not supported, assuming utf-8 in /wp-content/plugins/sitepress-multilingual-cms/inc/not-compatible-plugins.php on line 32
Step 1: Login to WHM
I’m assuming you know how to do this…
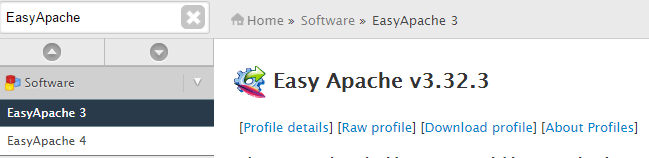
Step 2: Navigate to EasyApache
Fairly straight forward;
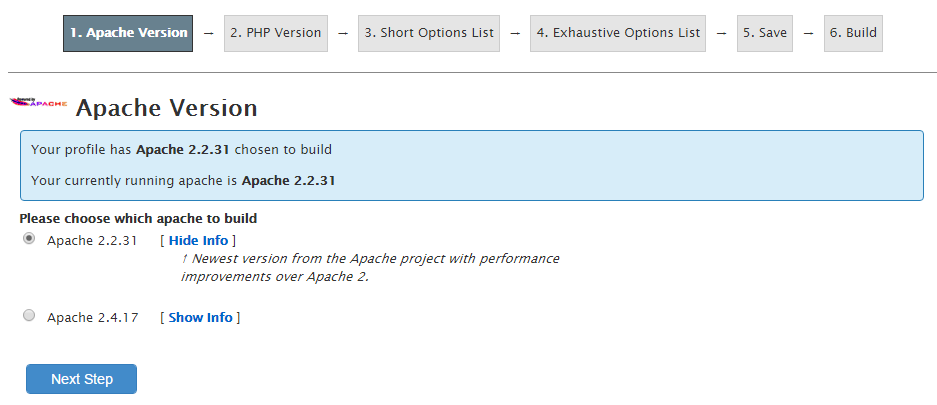
Step 3: Edit the Default Profile
Click on the gear icon;

Step 4: Follow the list of Settings
Work through the list of settings clicking on “Next” until you reach the “Exhaustive Options List”. Within here you will find an option for “PHP Mbstring” which can be selected to be turned on;
Step 5: Save & Build
One you have worked through the above settings your web server will run through the whole build process and eventually complete as can be seen below;
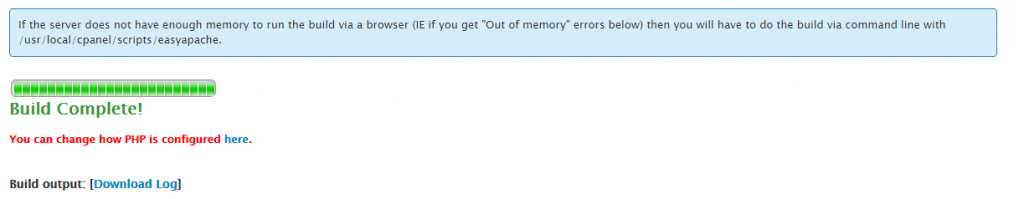
Note
As with any web server changes, make sure you have a backup before working through this. It goes without saying, but never the less, every web server is different so please make sure you understand what you are doing before jumping in with these types of changes.
by Michael Cropper | Sep 19, 2015 | Data and Analytics, Developer |
To put things into perspective, let’s look at the handy tools we have on our personal computers for monitoring computer resource usage. If you’re on a PC then you can easily view the Performance data within your Task Manager and I’m sure there is something similar for you Mac users out there;
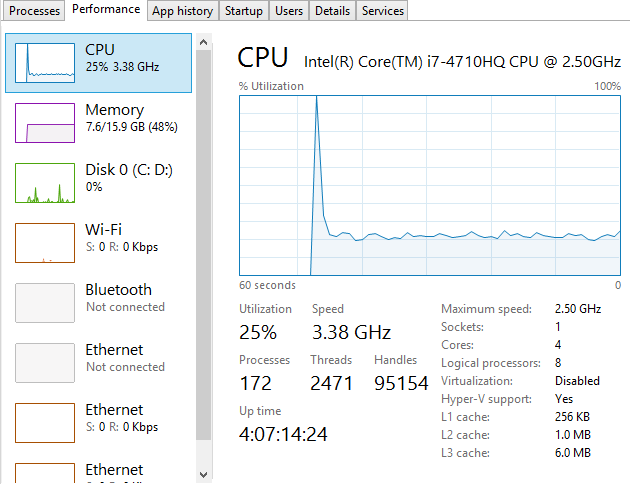
This is a very handy little tool which clearly shows you how your personal computer is performing and how things perform when you start to open new applications such as Microsoft Word or the memory eating Google Chrome browser. Here’s what happens when you kill Google Chrome after you have closed the application;

Interesting to say the least…
Anyhow, the point here is that monitoring the performance of your personal computer is relatively simple if you know where to look. Now we’re going to look at how to monitor your web server resources accurately using a suite of tools and also look at the significant differences between how different tools report on how many resources have been used and how many are free to use. The differences are what we are going to be focusing on as they are huge and can lead you to believe that you actually have more resources available than you really do.
Web Server Resources
Before we jump into monitoring your web server resources, let’s just define this. Essentially the key resources related to your web server include;
- CPU – The quantity of CPUs and their processing power in total.
- RAM – The quantity of memory currently in use and free for other things. Plus the quantity of RAM reserved for buffering and caching.
- Hard Disk Drive Space – The number of GBs of data you are using compared to the size of your disk.
- Disk I/O Utilisation – The number of input/output connections to the hard drive per minute which again has a limit
- Network I/O Utilisation – The amount of traffic on your physical network infrastructure
Behind all of these key metrics includes an enormous amount of information about the software that is running on the hardware and which processes are hogging these physical resources. This is where web server monitoring software comes in to its own as this can provide you with some extremely powerful data about how your web server is performing and most importantly, when you need to look at upgrading your web server to cope with the demands of the website or websites that are hosted on the web server.
Just as with your personal computer, web servers have a limit which needs to be managed effectively. If you tried to open 1000 Google Chrome browser tabs, your computer would probably grind to a halt as the physical hardware resources would be pushed over their limit. To the point where you would probably have to reboot your computer to resolve the problem. Your web server is no different, it’s just a little more complex, doesn’t have a physical button you can turn it on/off with (or kick!) and is sat in a huge data centre somewhere, ours are in Manchester & London.
When running a web server, it is clearly a little more important than your personal computer as this contains your website, the digital front of your business which is why it is essential to do everything physically possible to work towards a near 100% up-time. I’ll not cover today about why a 100% up-time is impossible to achieve and any guarantees of this are a flight of fancy, instead today we’re going to look at how to monitor your web server resources accurately using a suite of tools, specifically New Relic and Munin.
New Relic
We use New Relic on our web servers because it is extremely user friendly (well it is for someone of a technical nature compared to the other tools we have to work with). Being able to easily graph server resource usage to the n’th degree.
Which then further breaks this data down into the different processes that are using the resources, which websites hosted on the server are using the resources and also which user accounts are using the most resources and so on. Going beyond this, New Relic also allows us to monitor the up-time of our servers which is extremely useful for us to continually improve the performance of our servers over time;
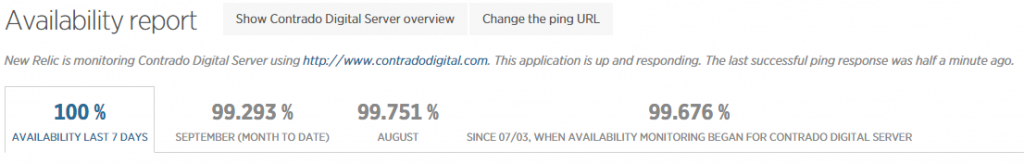
As mentioned previously, a 100% up-time is almost impossible to achieve due to various reasons which we’ll cover in another blog post. As you can see in August and September, the server has been performing exceptionally well overall but has had a couple of blips which we’ve worked to improve performance following this. The important aspect here is that we are tracking this data which means that we are capable of acting on these insights we have to continually improve the service to our customers. We already use industry leading server technology which can always be improved further by actively monitoring performance and improving areas which need attention.
What is interesting with the New Relic data though is that the memory usage data isn’t quite as accurate as it seems on first glance which is due to the way Linux organises data at the operating system level to improve performance. By default, Linux see’s RAM as wasted space if it isn’t used so it looks to utilise the available RAM to speed up performance. This is great in theory, although can cause a few issues if not carefully managed. Accessing data from RAM is up to 1000 times faster than accessing the same data from a hard drive which is why RAM is such a powerful way to increase the performance of technologies and hence make your website load faster. It’s a shame that it’s so expensive to purchase in comparison. I guess we’ll just have to wait for the next wave of hardware innovations to break through this barrier. Specifically related to server management and New Relic, the underlying way Linux classifies available RAM compared to how New Relic reports on this data isn’t quite accurate which can be misleading.
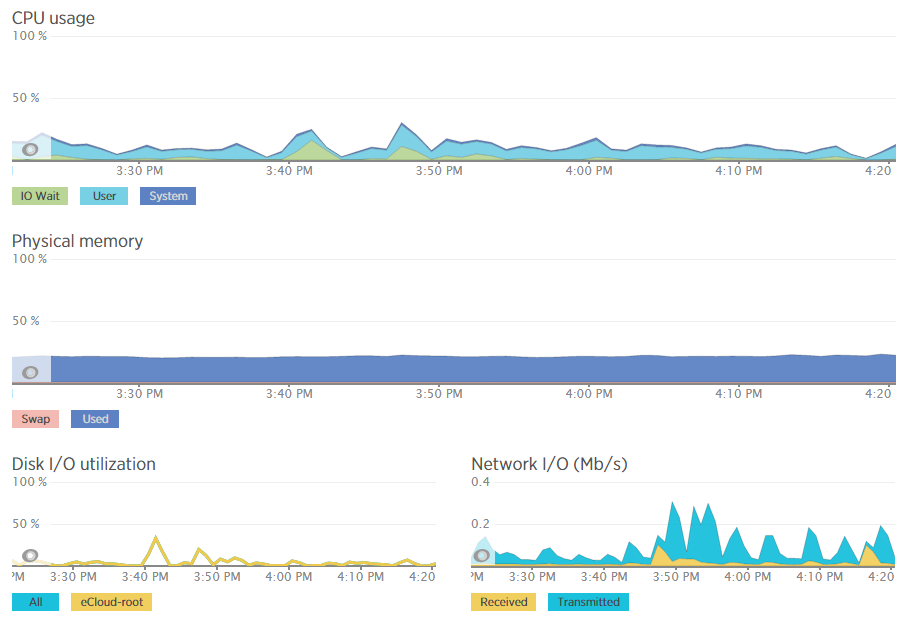
For example, when analysing one of the blips we had recently, at either side of the troublesome time, server resources within New Relic were being reported at well below 30% usage for CPU and well below 40% usage for RAM;
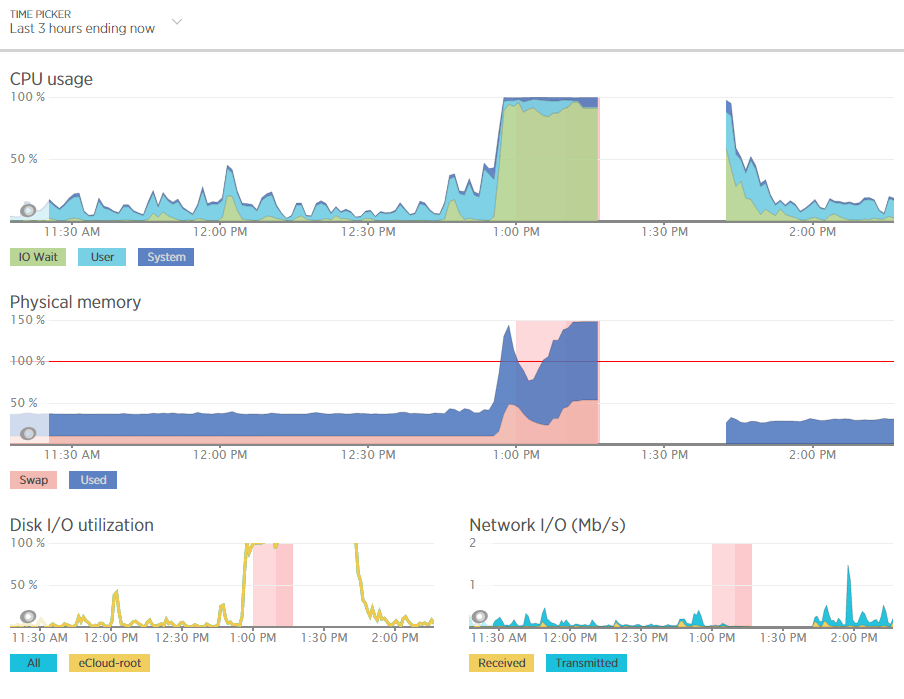
Although the blip happened for a specific reason which we needed to get to the bottom of this so we could prevent this happening again. Thankfully we have multiple tools at our disposal which allowed us to fully investigate the issue and take the necessary steps.
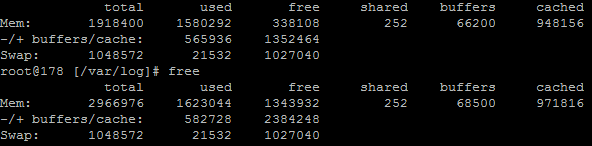
Using external tools is a great way of reporting on performance although they are external from the system and they may be reporting on data in a slightly different way. So we investigated this going back to the command line interface and logging into the server via SSH & PuTTY to query the server directly to get some more accurate information. What we found was rather interesting. When querying the server directly to see how much memory was being used this highlighted that the performance data within New Relic was actually quite a way off when it comes to its accuracy;
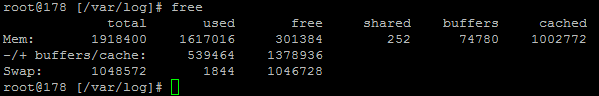
Here we see that there is only 300MB of RAM free out of 2GB opposed to the 60% free which equates to around 4x this figure at 1.2GB which is being reported in New Relic. Quite a difference here. The difference relates to the Buffer / Cache data which is being used by Linux to speed up the web server yet isn’t being taken into account by New Relic. While this is a nice setup to have, this does have its own performance issues when spikes occur which can lead to problems as outlined earlier.
Doing a one-off report for server resource usage via the command line is nice, but it is only a snapshot so doesn’t report on the true performance of the server over time. Thankfully we use another web server monitoring tool called Munin which essentially does a similar thing and much more then graphs all of this data over time.
Munin
Here is where the open source technology Munin comes in. Good old open source projects providing more insight than enterprise level software yet again. This is not a dig at New Relic as this software is really good, more of another stripe on the open source community for being so awesome.
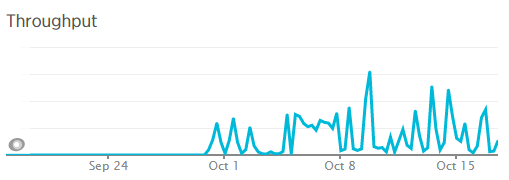
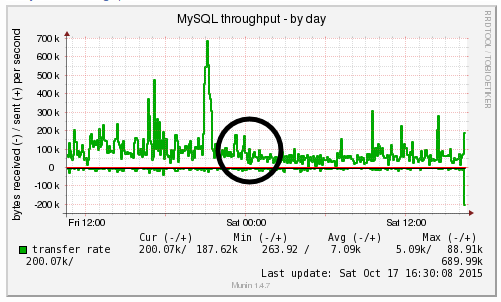
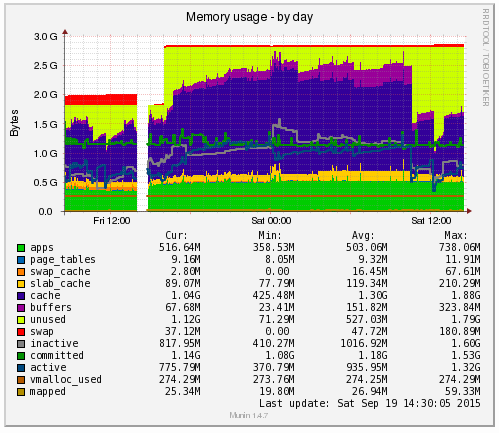
Munin is designed to report on how your web server is performing in a similar (but not as pretty) way as New Relic. When looking at the same data within Munin as what we were looking at within New Relic the data was clear to identify what caused the issue;
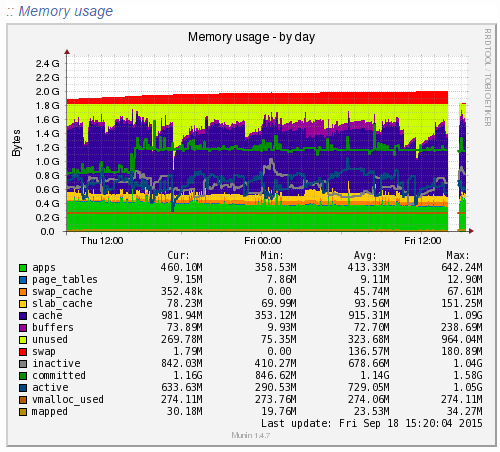
Ok, clear to me… What the above graph is showing can be summarised as;
- Red: This is the memory swap data which is outlined in more detail below. Importantly, this memory swap data is also highlighted on the New Relic graphs.
- Yellow: This is the available RAM
- Purple: This is the cached data sitting within the RAM. From New Relic’s point, this is available RAM, although from a physical hardware point, if we want to access this space we first have to clean something out, retrieve the data from the hard drive then add the data back in to RAM which consumes a large amount of processing power on the CPU
- Green: This is the memory taken from the applications in use on the web server
Note on the Red data in the graph above, the Memory Swap. What is actually happening here is that Linux is deciding what files to move in and out of memory based on what it thinks are the most important files. This work takes up valuable resources which is why the CPU levels and the Disk I/O levels on the New Relic graphs above spike right when this hits its peak. This is essentially the web server scrambling to optimise the performance at the detriment of its overall health. It’s the same as when you push yourself physically too much and then become ill from the process and need a rest. It’s the web server doing the same thing. When you start to see an increase or a significant amount of memory swap data within your New Relic graphs, I’d recommend checking to see what is really happening at the server level as this essentially highlights that your web server needs a bit more RAM or that you need to optimise the way Linux utilises the memory;
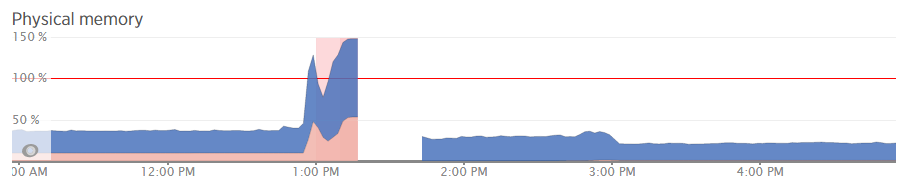
What all of this highlighted is that we needed to notch up the RAM on this server a bit. The aim was to increase the available RAM to allow for a greater amount of unused RAM meaning that the CPU nor the hard drive wouldn’t have to work as hard to access the information needed. As you can see, when we increased the RAM around 3pm in the above graph, the memory usage percentage went down within New Relic. As we know though, the New Relic data isn’t 100% accurate, so looking at the Munin data this highlights how we are now in a situation with this web server which means that the resource intensive memory swapping (the red bit on the graph) is minimal, there is more available RAM (yellow) and Linux has decided it wants to increase the cache so the websites load even faster than before;
Likewise when looking at the memory usage via SSH;
This again echoes the Munin data. The above data is in kBs, showing around 1.3GB of free RAM opposed to 300MB previously.
Summary
What is extremely simple to achieve on your personal computer is a little more challenging to setup, implement and report on for your web server. Web server management is an extremely specialised field which is why we only use the best technology with a dedicated team of server engineers behind the scenes to ensure that we are continually improving the performance of our web servers. All of this is to work towards the constant goal of 100% up-time for your business websites.
Not all web hosting is the same and not all web hosting companies work in the same way. Speaking for ourselves, we take web hosting seriously. A web server is not just a computer that sits in the corner somewhere which hosts your website. A web server is the cornerstone of your digital storefront which is why we invest heavily by utilising leading technologies allowing us to continually improve our services for all our web hosting customers.
As a take away from this post. If you’re a non-technical person looking for web hosting, you can guarantee that we’re ‘on it’ when it comes to hosting. If you’re a technical person reading this, then the top tip is to use multiple web server resource monitoring packages to provide a full insight into performance as some tools aren’t as accurate as they may seem on first glance.