To put things into perspective, let’s look at the handy tools we have on our personal computers for monitoring computer resource usage. If you’re on a PC then you can easily view the Performance data within your Task Manager and I’m sure there is something similar for you Mac users out there;
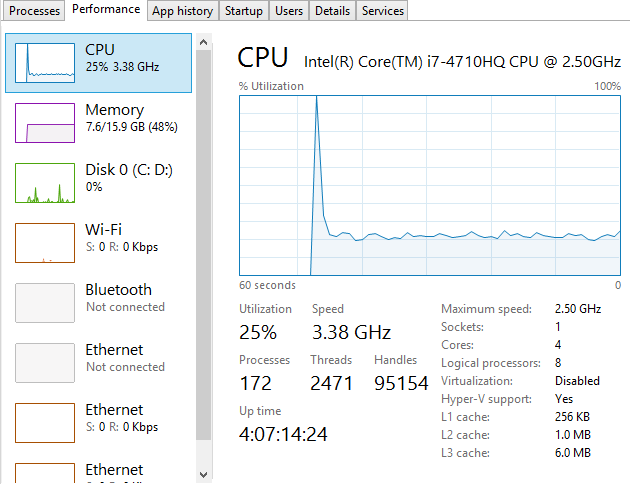
This is a very handy little tool which clearly shows you how your personal computer is performing and how things perform when you start to open new applications such as Microsoft Word or the memory eating Google Chrome browser. Here’s what happens when you kill Google Chrome after you have closed the application;
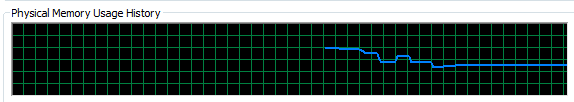
Interesting to say the least…
Anyhow, the point here is that monitoring the performance of your personal computer is relatively simple if you know where to look. Now we’re going to look at how to monitor your web server resources accurately using a suite of tools and also look at the significant differences between how different tools report on how many resources have been used and how many are free to use. The differences are what we are going to be focusing on as they are huge and can lead you to believe that you actually have more resources available than you really do.
Web Server Resources
Before we jump into monitoring your web server resources, let’s just define this. Essentially the key resources related to your web server include;
- CPU – The quantity of CPUs and their processing power in total.
- RAM – The quantity of memory currently in use and free for other things. Plus the quantity of RAM reserved for buffering and caching.
- Hard Disk Drive Space – The number of GBs of data you are using compared to the size of your disk.
- Disk I/O Utilisation – The number of input/output connections to the hard drive per minute which again has a limit
- Network I/O Utilisation – The amount of traffic on your physical network infrastructure
Behind all of these key metrics includes an enormous amount of information about the software that is running on the hardware and which processes are hogging these physical resources. This is where web server monitoring software comes in to its own as this can provide you with some extremely powerful data about how your web server is performing and most importantly, when you need to look at upgrading your web server to cope with the demands of the website or websites that are hosted on the web server.
Just as with your personal computer, web servers have a limit which needs to be managed effectively. If you tried to open 1000 Google Chrome browser tabs, your computer would probably grind to a halt as the physical hardware resources would be pushed over their limit. To the point where you would probably have to reboot your computer to resolve the problem. Your web server is no different, it’s just a little more complex, doesn’t have a physical button you can turn it on/off with (or kick!) and is sat in a huge data centre somewhere, ours are in Manchester & London.
When running a web server, it is clearly a little more important than your personal computer as this contains your website, the digital front of your business which is why it is essential to do everything physically possible to work towards a near 100% up-time. I’ll not cover today about why a 100% up-time is impossible to achieve and any guarantees of this are a flight of fancy, instead today we’re going to look at how to monitor your web server resources accurately using a suite of tools, specifically New Relic and Munin.
New Relic
We use New Relic on our web servers because it is extremely user friendly (well it is for someone of a technical nature compared to the other tools we have to work with). Being able to easily graph server resource usage to the n’th degree.
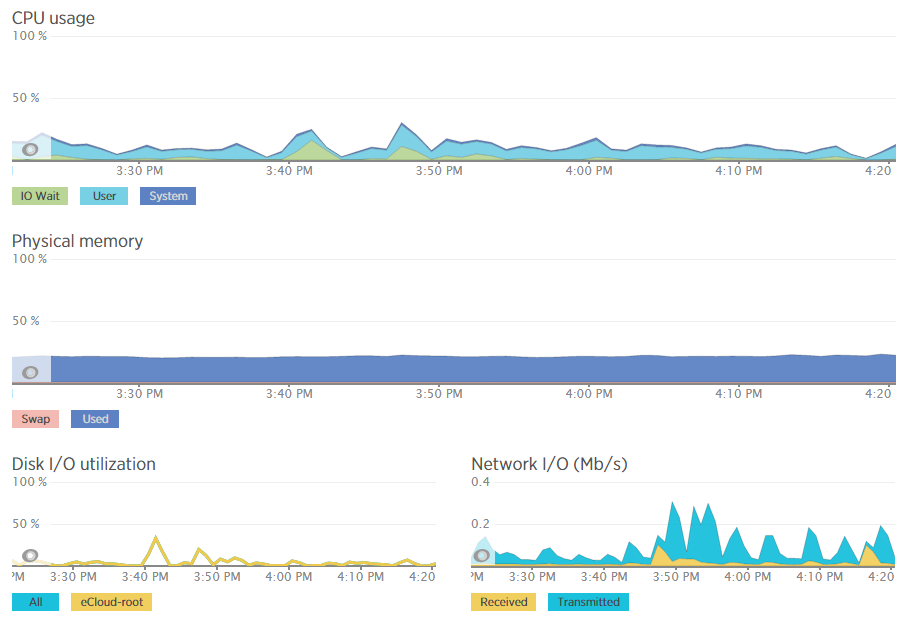
Which then further breaks this data down into the different processes that are using the resources, which websites hosted on the server are using the resources and also which user accounts are using the most resources and so on. Going beyond this, New Relic also allows us to monitor the up-time of our servers which is extremely useful for us to continually improve the performance of our servers over time;
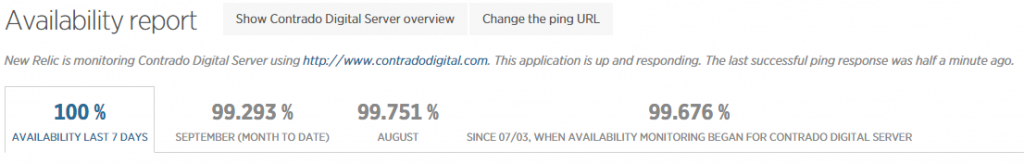
As mentioned previously, a 100% up-time is almost impossible to achieve due to various reasons which we’ll cover in another blog post. As you can see in August and September, the server has been performing exceptionally well overall but has had a couple of blips which we’ve worked to improve performance following this. The important aspect here is that we are tracking this data which means that we are capable of acting on these insights we have to continually improve the service to our customers. We already use industry leading server technology which can always be improved further by actively monitoring performance and improving areas which need attention.
What is interesting with the New Relic data though is that the memory usage data isn’t quite as accurate as it seems on first glance which is due to the way Linux organises data at the operating system level to improve performance. By default, Linux see’s RAM as wasted space if it isn’t used so it looks to utilise the available RAM to speed up performance. This is great in theory, although can cause a few issues if not carefully managed. Accessing data from RAM is up to 1000 times faster than accessing the same data from a hard drive which is why RAM is such a powerful way to increase the performance of technologies and hence make your website load faster. It’s a shame that it’s so expensive to purchase in comparison. I guess we’ll just have to wait for the next wave of hardware innovations to break through this barrier. Specifically related to server management and New Relic, the underlying way Linux classifies available RAM compared to how New Relic reports on this data isn’t quite accurate which can be misleading.
For example, when analysing one of the blips we had recently, at either side of the troublesome time, server resources within New Relic were being reported at well below 30% usage for CPU and well below 40% usage for RAM;
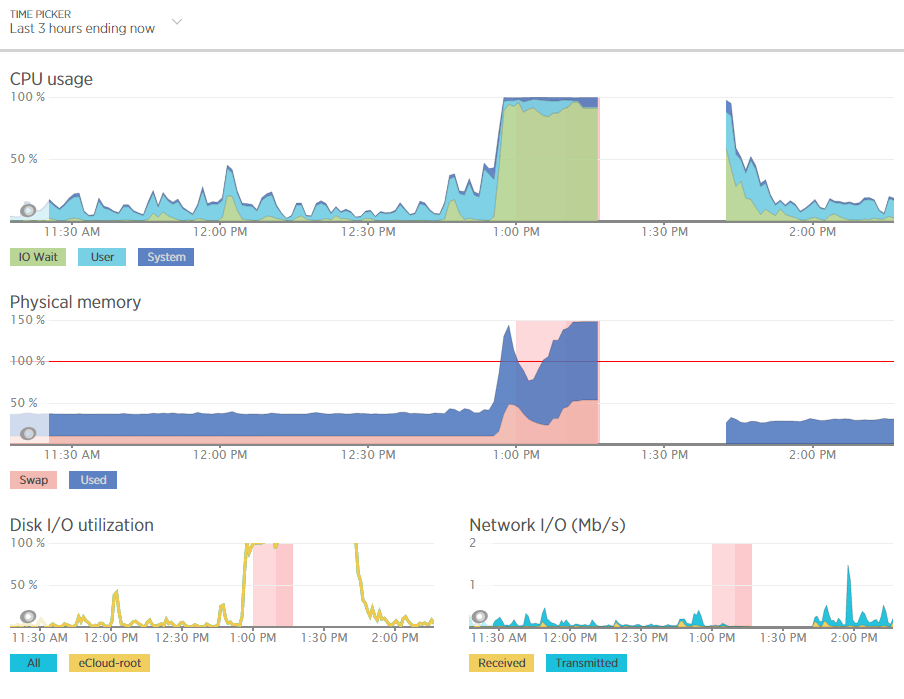
Although the blip happened for a specific reason which we needed to get to the bottom of this so we could prevent this happening again. Thankfully we have multiple tools at our disposal which allowed us to fully investigate the issue and take the necessary steps.
Using external tools is a great way of reporting on performance although they are external from the system and they may be reporting on data in a slightly different way. So we investigated this going back to the command line interface and logging into the server via SSH & PuTTY to query the server directly to get some more accurate information. What we found was rather interesting. When querying the server directly to see how much memory was being used this highlighted that the performance data within New Relic was actually quite a way off when it comes to its accuracy;
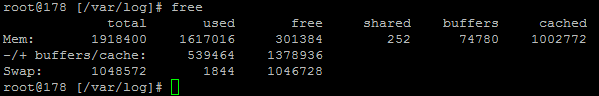
Here we see that there is only 300MB of RAM free out of 2GB opposed to the 60% free which equates to around 4x this figure at 1.2GB which is being reported in New Relic. Quite a difference here. The difference relates to the Buffer / Cache data which is being used by Linux to speed up the web server yet isn’t being taken into account by New Relic. While this is a nice setup to have, this does have its own performance issues when spikes occur which can lead to problems as outlined earlier.
Doing a one-off report for server resource usage via the command line is nice, but it is only a snapshot so doesn’t report on the true performance of the server over time. Thankfully we use another web server monitoring tool called Munin which essentially does a similar thing and much more then graphs all of this data over time.
Munin
Here is where the open source technology Munin comes in. Good old open source projects providing more insight than enterprise level software yet again. This is not a dig at New Relic as this software is really good, more of another stripe on the open source community for being so awesome.
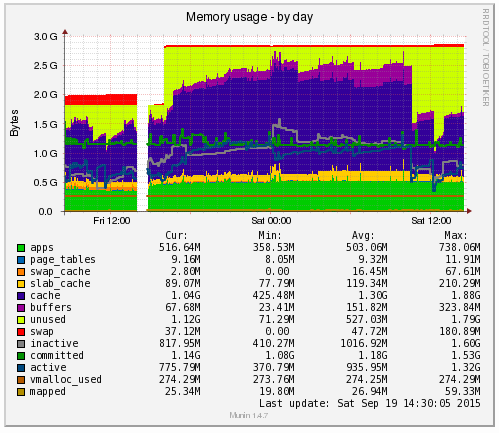
Munin is designed to report on how your web server is performing in a similar (but not as pretty) way as New Relic. When looking at the same data within Munin as what we were looking at within New Relic the data was clear to identify what caused the issue;
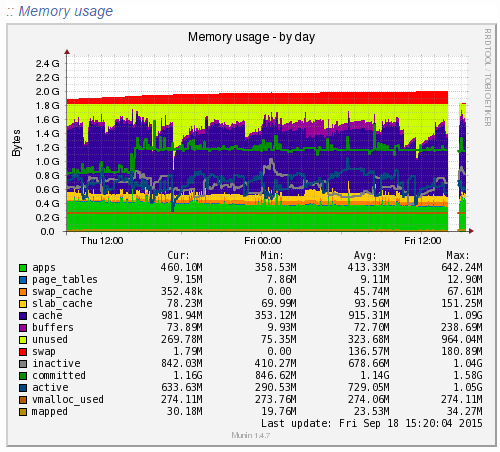
Ok, clear to me… What the above graph is showing can be summarised as;
- Red: This is the memory swap data which is outlined in more detail below. Importantly, this memory swap data is also highlighted on the New Relic graphs.
- Yellow: This is the available RAM
- Purple: This is the cached data sitting within the RAM. From New Relic’s point, this is available RAM, although from a physical hardware point, if we want to access this space we first have to clean something out, retrieve the data from the hard drive then add the data back in to RAM which consumes a large amount of processing power on the CPU
- Green: This is the memory taken from the applications in use on the web server
Note on the Red data in the graph above, the Memory Swap. What is actually happening here is that Linux is deciding what files to move in and out of memory based on what it thinks are the most important files. This work takes up valuable resources which is why the CPU levels and the Disk I/O levels on the New Relic graphs above spike right when this hits its peak. This is essentially the web server scrambling to optimise the performance at the detriment of its overall health. It’s the same as when you push yourself physically too much and then become ill from the process and need a rest. It’s the web server doing the same thing. When you start to see an increase or a significant amount of memory swap data within your New Relic graphs, I’d recommend checking to see what is really happening at the server level as this essentially highlights that your web server needs a bit more RAM or that you need to optimise the way Linux utilises the memory;
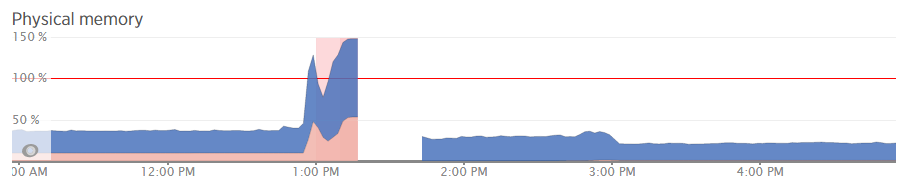
What all of this highlighted is that we needed to notch up the RAM on this server a bit. The aim was to increase the available RAM to allow for a greater amount of unused RAM meaning that the CPU nor the hard drive wouldn’t have to work as hard to access the information needed. As you can see, when we increased the RAM around 3pm in the above graph, the memory usage percentage went down within New Relic. As we know though, the New Relic data isn’t 100% accurate, so looking at the Munin data this highlights how we are now in a situation with this web server which means that the resource intensive memory swapping (the red bit on the graph) is minimal, there is more available RAM (yellow) and Linux has decided it wants to increase the cache so the websites load even faster than before;
Likewise when looking at the memory usage via SSH;
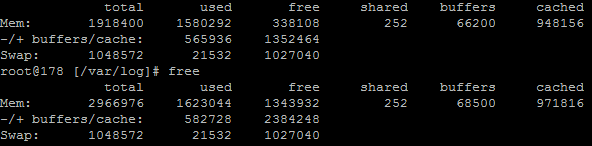
This again echoes the Munin data. The above data is in kBs, showing around 1.3GB of free RAM opposed to 300MB previously.
Summary
What is extremely simple to achieve on your personal computer is a little more challenging to setup, implement and report on for your web server. Web server management is an extremely specialised field which is why we only use the best technology with a dedicated team of server engineers behind the scenes to ensure that we are continually improving the performance of our web servers. All of this is to work towards the constant goal of 100% up-time for your business websites.
Not all web hosting is the same and not all web hosting companies work in the same way. Speaking for ourselves, we take web hosting seriously. A web server is not just a computer that sits in the corner somewhere which hosts your website. A web server is the cornerstone of your digital storefront which is why we invest heavily by utilising leading technologies allowing us to continually improve our services for all our web hosting customers.
As a take away from this post. If you’re a non-technical person looking for web hosting, you can guarantee that we’re ‘on it’ when it comes to hosting. If you’re a technical person reading this, then the top tip is to use multiple web server resource monitoring packages to provide a full insight into performance as some tools aren’t as accurate as they may seem on first glance.
Michael Cropper
Latest posts by Michael Cropper (see all)
- How to fix “Error establishing a database connection” on WordPress - May 19, 2026
- General Scheme of the Regulation of Artificial Intelligence Bill 2026 - February 4, 2026
- WGET for Windows - April 10, 2025